
Operation Manual


72 Tables, Charts, and Calendars
At this point, the chart is just a placeholder, using sample data
automatically added to the Chart Data tab. You can edit this sample
data using your own data, name your row/column headers, and even
add extra rows and columns to suit additional chart data—by default,
each row represents a separate colour-coded series component.
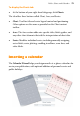
To edit data in the Chart Data tab:
1. Click
Chart Data under the selected chart. The Chart Data tab
displays temporarily in the workspace.
2. On the Chart Data tab, click in each cell and enter data as
appropriate. The chart will update with the newly entered values.
3. Replace the row and numeric column headers (i.e., Series 1, 2, and
3; and 1, 2, 3, 4, respectively) with real names. These will update in
your chart immediately.
Modifying charts
It is possible that you may want to change how your chart is presented.
The Chart context toolbar gives you the freedom to swap between chart
types, base your chart on different ranges, and toggle series as row or
columns.
Formatting and styling charts
The Charts tab serves a dual purpose in PagePlus—to fine tune the
chart's look and to manage how the series are used in your chart. In
addition, the Styles tab can be used to apply a completely new look to
your chart in one go, even swapping the chart type.