
Operation Manual


94 Tables, Charts, and Calendars
To create a chart from scratch:
1. From the Tools toolbar's
Table Tools flyout, select
Chart Tool.
2. On the context toolbar, from the Chart drop-down list, select a
chart type.
3. Click on the page or drag out the chart to the desired size.
At this point, the chart is just a placeholder, using sample data
automatically added to the Chart Data tab. You can edit this sample
data using your own data, name your row/column headers, and even
add extra rows and columns to suit additional chart data—by default,
each row represents a separate colour-coded series component.
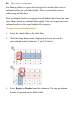
To edit data in the Chart Data tab:
1. Click
Chart Data under the selected chart.
The Chart Data tab displays temporarily in the workspace.
2. On the Chart Data tab, click in each cell and enter data as
appropriate.
The chart will update with the newly entered values.
3. Replace the row and numeric column headers (i.e., Series 1, 2, and
3; and 1, 2, 3, 4, respectively) with real names. These will update in
your chart immediately.
Modifying charts
It is possible that you may want to change how your chart is presented.
The Chart context toolbar gives you the freedom to swap between chart