
Operation Manual


Tables, Charts, and Calendars 91
Using charts
For any small business, club, or school project, the ability to present
important data professionally will impress your audience, and
potentially gain support for your activities.
Tables and charts are intrinsically linked in PagePlus. If you need a recap
on tables, see Creating tables on p. 87. PagePlus also lets you create
multiple charts from the same table data using the Chart Data tab. See
Manipulating chart data (in PagePlus Help) for more information.
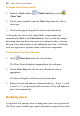
Chart types
PagePlus provides a range of popular chart types, each designed to
present data differently. All you need to do is select a chart that suits the
type of data you wish to present.
Area chart Bar chart Column chart
Line chart Pie chart Scatter chart (XY)
The above chart types are also available in 3D (as extrusions of the
2D chart types).