
User guide

the two minute break level, or PerformanceAnalysisDataRollup2. The retention hours for
this, or any other break level, can be adjusted as needed.
Retention for raw Top SQL, Blocking and Deadlock data is controlled by the Purge History
Older Than setting on the Performance Monitor tab under SQL Sentry Server->Settings in
the Navigator pane. The default is 15 days.
If you are using EM with PA, which enables viewing PA data on the EM calendar, the raw
Top SQL, Blocking, and Deadlock data is also converted to the native EM storage format
and stored in the EventSourceHistory table alongside data for other EM event sources like
SQL Agent Jobs and DTS. Retention for all EM sources is controlled by the Purge History
Older Than setting on the Event History Monitor tab under SQL Sentry Server->Settings in
the Navigator pane.
Expired performance data is pruned by the SQL Sentry Monitoring Service every minute or so. The
default settings are such that you should always have detailed performance data for the last two
or three days. However, if you find that you are frequently navigating to date ranges using the
Dashboard or Disk Activity tabs where no data is shown, it may mean that you need to increase the
retention hours for the detailed and/or rolled up performance data. You should of course balance any
changes with the resulting impact it will have on database size.
When you start using PA, you will likely find that your SQLSentry database grows quickly at first. After
a few days this will level off though, once the pruning of expired data begins and starts keeping pace
with the incoming new data. You can get a quick idea of the mix of PA data in your environment by
inspecting sizes for the related tables using the script below. Bear in mind that much of the data in
EventSourceHistory is likely related to EM sources.
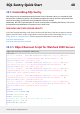
Performance Advisor Data Script
SELECT
TableName=OBJECT_SCHEMA_NAME([object_id])+'.'+
OBJECT_NAME([object_id]),
[RowCount]=SUM(CASEWHENindex_idIN(0,1)THENrow_countELSE0END),
UsedSpaceMB=SUM(used_page_count/128),
ReservedSpaceMB=SUM(reserved_page_count/128)
FROMsys.dm_db_partition_stats
WHEREOBJECT_NAME([object_id])IN
(
'BlockChainDetail',
'EventSourceHistory',
'MetaHistorySqlServerBlockLog',
'MetaHistorySqlServerTraceLog',
'PerformanceAnalysisData',
'PerformanceAnalysisDataDatabaseCounter',
'PerformanceAnalysisDataDiskCounter',
'PerformanceAnalysisDataRollup11',
'PerformanceAnalysisDataRollup2',
'PerformanceAnalysisDataRollup4',
'PerformanceAnalysisDataRollup6',
SQL Sentry Quick Start 38
©2015 SQL Sentry. All Rights Reserved.