
User's Manual
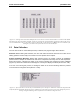
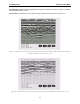
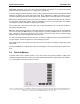
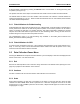
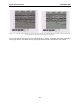
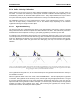
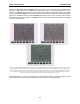
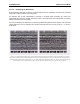
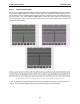
Table Of Contents
- 5 Data Collection Mode
- 6 Surveying Techniques
- 6.1 Low Frequency Reflection (Profiling) Mode
- 6.2 High Frequency Reflection (Profiling) Mode
- 6.3 Antenna Orientation
- 6.4 Triggers
- 6.5 Free Run
- 6.6 Odometer Data Acquisition
- 6.7 Signal Polarity
- 6.8 Spatially Aliasing the Data
- 6.9 Creating a Test Line for Data Quality
- 6.10 Adding GPS for Positioning
- 6.11 Common Mid-Point (CMP) Survey
- 6.12 Transillumination Surveys
- 7 Troubleshooting
- 8 File Management
- 9 Care and Maintenance
- 10 Helpful Hints
- Appendix A: Data File Formats
- Appendix B: GPR Signal Processing Artifacts
- Appendix C: Excerpts from the HP Fiber Optic Handbook
- Appendix D: Health & Safety Certification
- Appendix E: FCC Regulations
- Appendix F: Instrument Interference
- Appendix G: Safety Around Explosive Devices

5-Data Collection Mode pulseEKKO PRO
72
Trace Type: Depending on the user’s choice for Trace Plotting Type (Section 3.5.1: P56) the data will be
plotted as either grey scale (Figure 5-4) or wiggle traces (Figure 5-5).
In general, wiggle traces are commonly used for deep geological sounding where horizontal and vertical
distances are similar. Grey scale plots work better when exploration is shallow and traces must be
squeezed together because the vertical depth is much smaller than the horizontal distance on the display.
Axes: Time is plotted vertically from top to bottom and position is plotted horizontally from left to right on
the data image. Periodically, position values are displayed on the top of the data image. That position
corresponds to the left of the white box displaying the position.
On the bottom line of the screen the file name, trace number and position of the current trace are listed. It
also displays the GPS status.
Gain: The data are displayed with the current gain applied to the data. The gain value can be modified by
the user by pressing the Gain+ button to increase the gain or pressing the Gain- button to decrease the
gain. If the gain is changed in this way, the gain value is not saved and the next line collected will be
displayed with the current gain applied (Section 3.5.2: P58).
No matter which gain function has been selected, the data are ALWAYS stored in raw format WITHOUT
any gain applied. Gain is only applied for real-time display purposes.
More details about the actual data stored can be found in the section on formatting in Appendix A: Data
File Formats.
Pressing the Pause key suspends data collection and displays a menu with further options (Section 5.5:
P73).
5.4 Fiducial Markers
A fiducial marker flags a specific position on the data section during data acquisition. Adding these
markers during data collection is useful for recording significant landmarks or objects with known positions,
e.g. a survey stake, encountered during the survey.
Figure 5-6: Fiducial markers can be added to the data by pressing the Fiducial button during data acquisition. Fiducial markers
are written to the trace header of the next trace collected and displayed on the bottom of the data trace. Fiducial markers are
always an “F” followed by an incrementing number, i.e. F1, F2, F3, etc.