
User's Manual
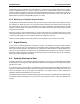
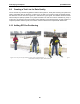
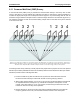
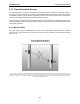
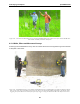
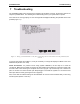
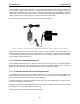
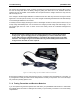
Table Of Contents
- 5 Data Collection Mode
- 6 Surveying Techniques
- 6.1 Low Frequency Reflection (Profiling) Mode
- 6.2 High Frequency Reflection (Profiling) Mode
- 6.3 Antenna Orientation
- 6.4 Triggers
- 6.5 Free Run
- 6.6 Odometer Data Acquisition
- 6.7 Signal Polarity
- 6.8 Spatially Aliasing the Data
- 6.9 Creating a Test Line for Data Quality
- 6.10 Adding GPS for Positioning
- 6.11 Common Mid-Point (CMP) Survey
- 6.12 Transillumination Surveys
- 7 Troubleshooting
- 8 File Management
- 9 Care and Maintenance
- 10 Helpful Hints
- Appendix A: Data File Formats
- Appendix B: GPR Signal Processing Artifacts
- Appendix C: Excerpts from the HP Fiber Optic Handbook
- Appendix D: Health & Safety Certification
- Appendix E: FCC Regulations
- Appendix F: Instrument Interference
- Appendix G: Safety Around Explosive Devices

pulseEKKO PRO 6-Surveying Techniques
93
6.12 Transillumination Surveys
For a transillumination survey the transmitter and receiving antennas are placed at opposite sides of a
structure to study the transmission properties of the dividing material. Depending on the structure shape, it
is desirable to obtain as many different raypaths through the structure as possible. This is achieved by
varying the transmitter and receiver geometry around the structure.
Users must keep systematic notes on antenna positions for each trace collected. Operation is best done in
Line mode (Section 5: P69) with a trigger used to initiate trace acquisition once the transmitter and receiver
are properly positioned.
6.12.1 Borehole GPR
The most common type of transillumination survey is cross hole GPR conducted between boreholes
(Figure 6-12) or from a borehole to the surface. This type of survey requires the use of borehole antennas
(Figure 6-13).
Figure 6-12: Cross hole transillumination surveys send signal from the transmitting antenna in one borehole to the receiving
antenna in another borehole. If this is done with the antennas at many different positions to collect data at many different raypaths
between the boreholes, travel times, amplitude variations and signal period changes can be analyzed to produce images of veloc-
ity, attenuation and dispersion.