
User's Manual
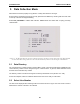
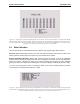
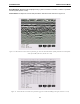
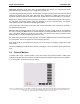
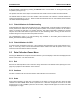
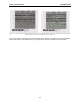
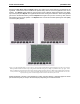
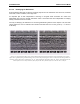
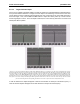
Table Of Contents
- 5 Data Collection Mode
- 6 Surveying Techniques
- 6.1 Low Frequency Reflection (Profiling) Mode
- 6.2 High Frequency Reflection (Profiling) Mode
- 6.3 Antenna Orientation
- 6.4 Triggers
- 6.5 Free Run
- 6.6 Odometer Data Acquisition
- 6.7 Signal Polarity
- 6.8 Spatially Aliasing the Data
- 6.9 Creating a Test Line for Data Quality
- 6.10 Adding GPS for Positioning
- 6.11 Common Mid-Point (CMP) Survey
- 6.12 Transillumination Surveys
- 7 Troubleshooting
- 8 File Management
- 9 Care and Maintenance
- 10 Helpful Hints
- Appendix A: Data File Formats
- Appendix B: GPR Signal Processing Artifacts
- Appendix C: Excerpts from the HP Fiber Optic Handbook
- Appendix D: Health & Safety Certification
- Appendix E: FCC Regulations
- Appendix F: Instrument Interference
- Appendix G: Safety Around Explosive Devices

5-Data Collection Mode pulseEKKO PRO
76
Pressing the Up, Down, Left, and Right buttons once makes a very small change in the position of the
hyperbola. These buttons must sometimes be pressed many times to move the hyperbola to the correct
position. The Repeat button speeds up the movement of the hyperbola. Select the direction (Left, Right,
Up or Down) and press Repeat. The hyperbola will then start moving in that direction. When the hyperbola
gets close to the desired location, press the Repeat button again to stop it. Then use the up, down, left and
right buttons to fine-tune the position. The Repeat button can also be used after pressing the wider (Vel+)
or narrower (Vel-) buttons.
Figure 5-9: Hyperbola matching to extract velocity. After pressing the Calib button a hyperbola appears on the screen (top left).
This hyperbola should be moved overtop of a hyperbola in the data using the Left, Right, Up and Down keys (top right). It can
then be widened or narrowed to match the shape of the hyperbola in the data (bottom). When the hyperbola shapes match, the
velocity listed on the bottom of the screen can be used to make depth estimates more accurate in subsequent data. As well, the
depth of the target that created the hyperbola is listed on the bottom of the screen.
Depths will appear in metres or feet depending on which units are selected. Velocities appear in metres
per nanosecond (m/ns) or feet per nanosecond (ft/ns) depending on the Positional Units.