
User's Manual
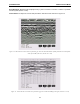
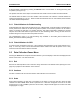
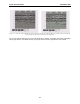
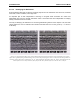
Table Of Contents
- 5 Data Collection Mode
- 6 Surveying Techniques
- 6.1 Low Frequency Reflection (Profiling) Mode
- 6.2 High Frequency Reflection (Profiling) Mode
- 6.3 Antenna Orientation
- 6.4 Triggers
- 6.5 Free Run
- 6.6 Odometer Data Acquisition
- 6.7 Signal Polarity
- 6.8 Spatially Aliasing the Data
- 6.9 Creating a Test Line for Data Quality
- 6.10 Adding GPS for Positioning
- 6.11 Common Mid-Point (CMP) Survey
- 6.12 Transillumination Surveys
- 7 Troubleshooting
- 8 File Management
- 9 Care and Maintenance
- 10 Helpful Hints
- Appendix A: Data File Formats
- Appendix B: GPR Signal Processing Artifacts
- Appendix C: Excerpts from the HP Fiber Optic Handbook
- Appendix D: Health & Safety Certification
- Appendix E: FCC Regulations
- Appendix F: Instrument Interference
- Appendix G: Safety Around Explosive Devices

5-Data Collection Mode pulseEKKO PRO
74
Figure 5-7: A time axis (left) and depth axis (right) can be plotted on the left of the data image by pausing the data collection and
pressing Scale once for a time axis and twice for a depth axis.
The user should be aware that if an accurate depth axis is desired, the proper radar wave propagation
velocity (see Section 3.2.6 Radar Velocity on page 39) must be used to generate the correct depth.