
User's Manual
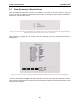
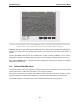
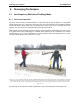
Table Of Contents
- 5 Data Collection Mode
- 6 Surveying Techniques
- 6.1 Low Frequency Reflection (Profiling) Mode
- 6.2 High Frequency Reflection (Profiling) Mode
- 6.3 Antenna Orientation
- 6.4 Triggers
- 6.5 Free Run
- 6.6 Odometer Data Acquisition
- 6.7 Signal Polarity
- 6.8 Spatially Aliasing the Data
- 6.9 Creating a Test Line for Data Quality
- 6.10 Adding GPS for Positioning
- 6.11 Common Mid-Point (CMP) Survey
- 6.12 Transillumination Surveys
- 7 Troubleshooting
- 8 File Management
- 9 Care and Maintenance
- 10 Helpful Hints
- Appendix A: Data File Formats
- Appendix B: GPR Signal Processing Artifacts
- Appendix C: Excerpts from the HP Fiber Optic Handbook
- Appendix D: Health & Safety Certification
- Appendix E: FCC Regulations
- Appendix F: Instrument Interference
- Appendix G: Safety Around Explosive Devices

pulseEKKO PRO 5-Data Collection Mode
81
Figure 5-16: Viewing an existing data line. The data image scrolls onto the screen just like during real data collection. The scroll
speed can be increased and decreased using the A and B buttons. The line can be plotted with a different gain or use the Gain+
and Gain- buttons to increase and decrease the current gain value. ReStart will plot the line again.
Replaying data can be very useful because it allows the user to quickly modify the plot with different gains
(Section 3.5.2: P58), and Trace Plotting Type (Section 3.5.1: P56) to try and enhance the feature of
interest.
Pressing the Pause allows access to the Calib button so that a Velocity Calibration can be used to
determine the velocity in the material being scanned or check for airwave reflectors (Section 5.5.4: P75).
Each time the ReStart button is pressed the data is replotted so if settings are changed, the modified
image replaces the old one.
5.8 Collect Data (No Save)
This selection allows data to be acquired and plotted to the screen but not saved to a file. Once the data
scrolls off the screen or when the line is exited, it can no longer be viewed.
This option is useful when the operator just wants to collect a test line to see what conditions are like,
perhaps to decide on the best antenna frequency to use in the area or the length of the time window.
During data acquisition, the bottom of the screen will indicate that data are not being saved.