
Users Manual
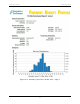
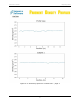
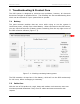

Table Of Contents

PDP User's Guide Exporting Data
59
Profile Plot
The plot for a Profile line is shown in Figure 6-4. The total line length was 14.8m,
and since a data sample is taken every 0.1m, a total of 149 measurements were
taken.
Since Density was chosen as the parameter to display, the histogram plot shows
the distribution of density for the 149 measurements.
A complete Profile view of density vs. position is shown, starting on page 2 (Figure
6-5). If the line is longer than 10m, then the position range auto scales and
generates subplots beneath, allowing the user to see more detail.