
Users Manual
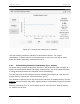
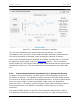
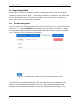
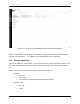
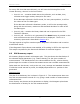
Table Of Contents

PDP User's Guide Exporting Data
57
For every PDP Line that was collected, you will have the following files in the
Lineset directory, where X is the line number:
• Line<X>.csv – contains details about the collection, such as date, time,
collection and trigger modes, descriptive file name.
If the data was collected in Profile mode, for every trace position, it will list
the values of the five data types.
If the data was collected in Stationary mode, it will list the average value,
along with the minimum, maximum and standard deviation for each of the
five data types.
• Line<X>.pdp – contains the binary data and can be opened in the PDP
Toolkit PC software.
• Line<X>.pdf – this file is only generated if the Stats button is pressed on the
main collection screen when a collected line is displayed. The file is a
summary report and is described in Section 6.3.
The app.log and cp.log files contains system diagnostic information and is used to
troubleshoot issues.
If the Diagnostic Export button was enabled, a file ending in GPZ is also exported.
This maybe requested by the Sensors & Software for technical support.
6.3 PDP Summary report
All Summary Reports contain a histogram plot. This plot shows the distribution of
the selected display parameter (e.g. relative density) for the given number of
measurements. The distribution are the values obtained for say, relative density,
plotted again the number of times that measurement was recorded measurements.
Other stats are also shown, such as the min, max, average and standard deviation.
If collection mode was set to profile, the displayed parameter vs. position is also
generated.
Stationary Plot
The plot for a Stationary line is shown in Figure 6-3. The measurement time was
30s with a measurement interval of 0.1s, giving a total number of measurements
collected as 300.
Since Density was chosen as the parameter to display, the histogram plot shows
the distribution of density for the 300 measurements.