
Users Manual
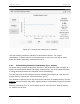
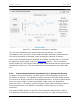

Table Of Contents

PDP User's Guide Methodology
53
for the site specific relationship between K and density (details in Appendix G:). The
PDP Toolkit PC Software is provided with the PDP system to carry out this
computation which results in site specific coefficients A, B and C as well as the user
defined maximum density. The values of A, B and C and maximum density are
entered into the PDP and the PDP will display site specific density.
The basic steps are as follows:
• Traverse a line or run multiple passes to cover an area using the K or
standard density data display.
• Identify anomalous areas (where high and low values are observed) and
target these locations for cores to obtain reference density values (via coring
or other non-destructive technique such as Nuclear Density Gauge)
• Run PDP in stationary mode to collect data at these locations
• Use the PDP Toolkit PC Software to enter this information in a chart form,
along with the site specific maximum density.
• Use the PDP Toolkit PC Software to compute and determine the A, B and C
coefficients
• Apply the calculated A, B and C coefficients and the Maximum Density in the
PDP Toolkit software (using the modify parameters utility)
• Now any collected lines will display the true density
• If necessary, the A, B and C coefficients, along with Maximum Density can be
entered into the PDP collection software in the field for future lines collected
at that site.
5.4 Outputs
Data collected with the PDP can be output into a summary report (PDF file) using
the Stats button (described in Section 5).
Plan maps can also be generated by collecting a series of profiles over a given area.
Once the data is downloaded from the PDP, it needs to be imported into the PDP
Toolkit PC Software to create plan maps. Details are explained in the PDP Toolkit
PC manual.