
Users Manual
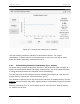
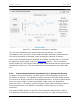

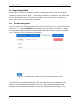
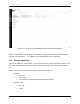
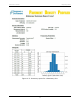
Table Of Contents

PDP User's Guide Methodology
52
Figure 5-2: Sample plot of density vs. position
The user can immediately see areas of high and low density. For further
investigation, move the PDP to those areas and obtain stationary measurements.
The system generates a histogram report showing the variation in density.
If any cores are obtained where PDP data is collected, the data can be “corrected”
by applying a density offset (under the Parameters button). This is essentially
ground truthing by verifying the observed PDP measurements with the actual value
obtained from the cores. This correction factor can be applied to the whole data
set.
5.3.3 Transforming Dielectric Permittivity (K) to Site Specific Density
To obtain a site specific density, the PDP requires a more detailed conversion of
permittivity to density. The approach normally used is to take PDP measurements
over an area or along a transect of new asphalt pavement. A series of points where
there are zones of high, low and intermediate range values are identified as
reference points. The density at these locations (called reference density values)
are determined from core samples (or possible nuclear density or Q-meter
measures).
The measured PDP values of K and the reference density values (from coring or
non-destructive methods) are then used to create the 2
nd
order polynomial curve