
Users Manual
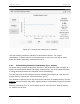
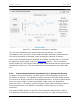

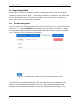
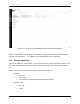
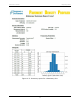
Table Of Contents

PDP User's Guide Methodology
51
Figure 5-1: Sample plot showing K vs. position
This will already provide an indication of anomalous regions. For further
investigation in areas where K is noticeably high or low, move the PDP to those
areas and obtain stationary measurements of K.
5.3.2 Transforming Dielectric Permittivity (K) to density
For some users, seeing the data from the PDP in actual density units is helpful as
density is the standard asphalt variability measurement. All of the steps described
in using permittivity above are followed in this methodology.
The user has only to select display density instead of permittivity K. PDP will now
output density in grams per cubic centimeter (g/cm
3
).
The variation in density will be the same as the variation of asphalt density, but the
absolute value of density may differ slightly because a simplified conversion formula
is used.
Start by traversing a line or run multiples lines to cover an area. Display density
vs. position on the plot.