
Users Manual
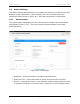
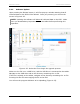
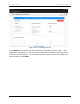
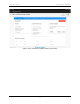
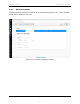
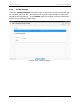
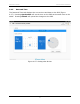
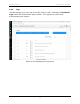
Table Of Contents

PDP User's Guide PDP Collection Software
40
4.3 Stats
Pressing the Stats button will generate a PDP Summary Report, as a PDF file.
Whatever data is currently displayed is used to generate the Summary Report. So,
if profile collection mode is used displaying Density, then this is plotted in the
Summary Report. Note that density and permittivity are calculated automatically
can be easily plotted from each other. But if the user wants to plot any of the
others (Density – Site Specific, Relative Density or Air Void Content), they would
need to enter the A, B, C and Max Density Values under the Parameters button
before these can be plotted.
After pressing the Stats button, a window will pop-up advising that the user can
view the file (press View) or just move on with out viewing (press Done).
Pressing View will download the PDF file immediately to the Tablet (Downloads
directory), where it can be opened.
Pressing Done will do nothing, but the PDF file is generated and will be downloaded
along with the actual PDP data when the user selects Download (see Section 4.1.4
on File Management).
The report is discussed and shown in Section 6.3.