
Users Manual
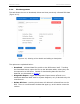
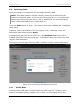
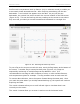
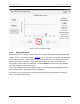
Table Of Contents

PDP User's Guide PDP Collection Software
36
immediately after the asphalt has been laid, compacted and allowed to cool, to
check for the for the consistency of the asphalt density.
As the cart is pushed along, distance is plotted along the horizontal axis, and
whatever data parameter is selected from Plot Options (Section 4.1.3) is plotted on
the vertical axis (Figure 4-17).
Figure 4-17: Collecting data in Profile mode
The measurement stats are displayed on the right side, showing the current value
as well as the min, max and average values obtain for this line.
If a GPS is enabled, the GPS positions are also displayed.
In the top right of the screen there are few icons. These are explained from left to
right:
• GPS quality indicator – refers to the external GPS. Highlighted bars indicate
quality of signal. If it says “Disconnected”, then the GPS is unplugged. If it
says, “No Signal”, the view of the sky is obstructed.
• GPR active indicator – it will animate as the system is collecting data
• Question mark – pressing this will launch this user’s guide
• Battery power – icon and percentage power are shown