
Users Manual
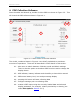
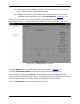
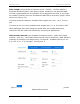
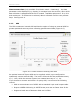
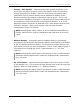
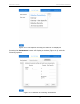
Table Of Contents

PDP User's Guide PDP Collection Software
26
4.1.3 Plot Options
This tab controls how the data is displayed in the main window (Figure 4-7).
Figure 4-7: The display for Plot Options
Data displayed: during data collection, one of five different measurements can be
displayed (Figure 4-8). Note that all measurements are calculated from the
reflection amplitude of the GPR wave. The measurements are described below.
Details on how these measurements are derived can be found in Appendix G:.
• Relative Permittivity (K) – also known as the relative dielectric
permittivity, this is the initial value calculated by PDP. Relative permittivity is
expressed as a unitless quantity relative to the permittivity of free space. All
other parameters below are derived from the relative permittivity.
• Density – displays absolute density of the asphalt, expressed in units of
g/cm
3
. This is a simple calculation that derives density from the observed
relative permittivity. If you have a core sample with a known density, you
can apply a density offset, such that the measured PDP parameter at the
core location equals the known density of the core. This offset is then
applied to all the PDP data. Note that in some cases a nuclear density gauge
reference value may be used to determine a suitable offset.