Users Manual Version 1.
Smart Systems User’s Manual Version 1.
Smart Systems User’s Manual Version 1.1 Information on pulseEKKO, Noggin and Conquest Products Regarding Electromagnetic Emissions Emissions All governments have regulations on the level of electromagnetic emissions that an electronic apparatus can emit. The objective is to assure that one apparatus or device does not interfere with any other apparatus or device in such a way as to make the other apparatus non-functional. Sensors & Software Inc.
Smart Systems User’s Manual Version 1.1 Sensors & Software Inc. monitors the research in this area. To date, the power levels of Sensors & Software Inc.’s products are so small as to be inconsequential compared to other common sources. If you are happy that a cell phone is not hazardous, then Sensors & Software Inc.’s product, being of much lower power, need be of little concern. Also see Appendix B - Health & Safety Certification.
Smart Systems User’s Manual Version 1.1 Copyright and Warranty Information Software Licence & Limited Warranty Important: Please read this document carefully before removing the SOFTWARE PRODUCT diskettes from their protective cover or assembling the HARDWARE PRODUCT. By removing the diskettes or assembling the hardware, you are agreeing to become bound by the terms of this agreement. If you do not agree to the terms of this agreement, promptly contact Sensors & Software, Inc.
Smart Systems User’s Manual Version 1.1 Product Limited Warranty SSI warrants the HARDWARE PRODUCT to be free from defect in material and workmanship under normal use for a period of ninety (90) days from the date of shipment. Any computer systems purchased with the product are subject to the manufacturer's warranty and not the responsibility of SSI.
Smart Systems User’s Manual Version 1.1 Serviceability Should any term of this agreement be declared void or not enforceable by any court of competent jurisdiction, the remaining terms shall remain in full effect.
Smart Systems User’s Manual Version 1.
Smart Systems User’s Manual Version 1.1 TABLE OF CONTENTS 1 GENERAL OVERVIEW .................................................................................1 2 ASSEMBLING THE SMART CART...............................................................2 2.1 3 3.1 Configuring the Smart Cart to Carry a Different Noggin System............................................ 10 ASSEMBLING THE SMART HANDLE SYSTEM ........................................11 Smart Handle...........................................
Smart Systems User’s Manual Version 1.1 Input a Velocity Value......................................................................................................................... 30 5.3.5 Depth Menu ................................................................................................................................ 31 5.3.6 Gain Menu .................................................................................................................................. 31 5.3.7 Start Menu..........
Smart Systems User’s Manual Version 1.1 5.8 Advanced Topics ........................................................................................................................... 54 5.8.1 How Depth is Determined........................................................................................................... 54 6 NOGGINPLUS ................................................................................................55 6.1 Overview of Nogginplus Menu Options ..............................
Smart Systems User’s Manual Version 1.1 X Lines Only - Forward .................................................................................................................. 75 Y Lines Only - Forward .................................................................................................................. 76 XY Lines - Forward ........................................................................................................................ 76 Survey Format .................................
Smart Systems User’s Manual Version 1.1 8.3 Skid Pads........................................................................................................................................ 95 APPENDIX A NOGGINPLUS DATA FILE FORMAT........................................ A-1 APPENDIX B HEALTH AND SAFETY CERTIFICATION ............................. B-1 APPENDIX C FCC REGULATIONS .............................................................. C-1 APPENDIX D OPERATION OF SHUT OFF SWITCH ................
Smart Systems User’s Manual Version 1.
Smart Systems User’s Manual Version 1.1 1 General Overview Noggin Smart Systems are integrated ground penetrating radar (GPR) data acquisition platforms. Once the unit has been assembled and powered up you can be carrying out a GPR survey in less than a minute. There are two different configurations available, the Smart Cart system and the Smart Handle system (see Figure 1-1). The Smart Cart system consists of the cart structure, a Noggin, an odometer wheel, a digital video logger (DVL), and a battery.
Smart Systems User’s Manual Version 1.1 2 Assembling the Smart Cart The Noggin Smart Cart can be configured for Noggin 250, Noggin 500 or Noggin 1000 operation. For the Noggin 250 Smart Cart, refer to Figure 2-10. For the Noggin 500 Smart Cart, refer to Figure 2-11 and for the Noggin 1000 Smart Cart, refer to Figure 2-12.
Smart Systems User’s Manual Version 1.1 The Noggin Smart Cart comes fully assembled but in collapsed position (Figure 2-2). The steps necessary to have a fully functioning system are: Figure 2-2: Smart Cart in collapsed position. 1. Attach wheels (if necessary): The Smart Cart may have been shipped without the wheels attached or they may have been removed for storage.
Smart Systems User’s Manual Version 1.1 a ¼ inch Allen (hexagonal) wrench to loosen the screws on the side of the odometer (see Figure 2-10 or Figure 2-11) and pivot the entire odometer unit until the small odometer wheel makes good contact with the side of the cart wheel. Then tighten the screws to lock the odometer wheel in this position. After this has been done, it will be necessary to re-calibrate the odometer (see Section 6.5.2). Figure 2-4: Smart Cart set up. 3.
Smart Systems User’s Manual Version 1.1 Once all 4 swivel adapters are attached, the Noggin can then be attached to the Smart Cart. The Noggin is usually attached to the cart with the long axis of the Noggin unit parallel to the wheels on the cart (see Figure 2-10 ,Figure 2-11 and Figure 2-12). For this orientation, make sure the 37 socket female electrical receptacle on the Noggin faces the back of the cart so that the cable on the cart will reach the receptacle.
Smart Systems User’s Manual Version 1.1 Attach Cross bars to the cart (if necessary). a) Line up holes. b) Insert Clevis pin. Attach Noggin to cross bar. a) Insert cross bar into swivel adapter. b) Insert Clevis pin. Figure 2-7: Attaching the Noggin 500 and Noggin 1000 to the cart. Connect the cable with the 37-pin male D connector to the Noggin and secure this attachment by tightening the hand screws. 4.
Smart Systems User’s Manual Version 1.1 Figure 2-8: Attaching the digital video logger (DVL). Step 1: Depress flexible clip. Step 2: Slide DVL onto shelf. Once the Digital Video Logger is in place, attach the cable with the 37-socket female Dconnector to the 37-pin receptacle on the back of the Digital Video Logger. This attachment can be secured by tightening the hand screws. The Digital Video Logger can be pivoted to adjust the view angle.
Smart Systems User’s Manual Version 1.1 5. Attach the Battery Unit: Set the battery unit onto the lower inclined shelf on the back of the Smart Cart (see Figure 2-9). The handle on the battery unit should be accessible from the back of the cart with the cable receptacle on the right. The battery unit should rest in this area without moving. To secure the battery onto the cart, put the straps provided over the battery unit and lock into place with the plastic buckle. Tighten the straps if necessary.
Smart Systems User’s Manual Version 1.
Smart Systems User’s Manual Version 1.1 2.1 Configuring the Smart Cart to Carry a Different Noggin System The Noggin Smart Cart can be configured to carry a Noggin 250, Noggin 500 or a Noggin 1000 system. This can be done by replacing the two support arms on the cart (see Figure 2-13) with the support arms for another system. Each arm is attached to the cart by two hand screws. For each arm, remove the screws, detach the arm from the cart and replace it with the new arm.
Smart Systems User’s Manual Version 1.
Smart Systems User’s Manual Version 1.1 3.1 Smart Handle The Smart Handle consists of the Smart Handle grip and Smart Handle extension. These two pieces are put together (see Figure 3-2 and Figure 3-3) and then attached to the Noggin (see Figure 3-4). The system can be deployed without the handle extension as shown in Figure 3-5 and Figure 3-6.
Smart Systems User’s Manual Version 1.1 Figure 3-4: Now connect the other end of the Smart Handle extension to the Noggin by simply pushing it in. Figure 3-5: If short handle is required, it may be easier to just connect the SmartHandle grip to the Noggin without the extension.
Smart Systems User’s Manual Version 1.1 button on the pole extending from the Noggin and pull apart. 3.2 Cabling 3.2.1 DVL to Sensor Cable The DVL to Noggin cable is a Y-shaped cable with 3 connections; one to the Noggin sensor, one to the DVL and one to the power supply (battery or AC). Noggin Connection: The first connection is to attach the 37-pin connector on the cable to the 37-socket connector on the Noggin. Use the thumb screws to secure this connection.
Smart Systems User’s Manual Version 1.1 Power Connection: The third connection on the Smart Handle cable attaches to a power supply. The round, 4-pin connector attaches to either the standard battery or optional AC adapter. 3.2.2 Odometer Cable The cable connecting the odometer or positioning wheel comes already installed at the factory. 3.2.3 Smart Grip Cable The Smart Grip Cable is used to connect the Smart Handle button and beeper into the system.
Smart Systems User’s Manual Version 1.1 4 Starting the Digital Video Logger Once all the cable connections are made between the Noggin, the Digital Video Logger (DVL) and the battery, the upper red LED light on the DVL panel should be lit. If the battery voltage is low, the light will flash for about 30 seconds and go out. If the light flashes or does not appear, check the connections and make sure the battery is fully charged. (See Section 8.1 for more information on battery care.
Smart Systems User’s Manual Version 1.1 Screen: The DVL screen is a grayscale LCD selected for its wide temperature range and visibility in sunlight. Visibility can be a major problem with viewing GPR data displays outdoors and considerable effort has been expended on getting a readily visible outdoor display. Brightness: The yellow Brightness control arrows are used to increase and decrease the screen brightness.
Smart Systems User’s Manual Version 1.1 When the Smart Cart is not being used, do not leave the battery plugged in. The system draws about 0.1 amps even when it is powered off and this will gradually drain the battery. 4.1 Running a DVL Detached from a Smart System When collecting data with a Smart System, the DVL is powered by the system battery.
Smart Systems User’s Manual Version 1.1 5 Noggin 5.1 Overview of Noggin Menu Options The Noggin main menu has the following choices: A – RUN B – DEMO 1 – NOGGIN SETUP 2 – TRANSFER ALL BUFFERS 3 – DELETE ALL BUFFERS 4 – UPGRADES 7 – RETURN 12.1 V Rev 6.00 5.1.1 Run Pressing the A button starts the Noggin data acquisition program (see Section 5.4). 5.1.2 Demo Pressing the B button starts the Noggin Demonstration program.
Smart Systems User’s Manual Version 1.1 5.1.5 Delete All Buffers Pressing the number 3 on the main menu allows the user to delete ALL the data buffers currently saved on the DVL. See Section 5.6.2 5.1.6 Upgrades Pressing the number 4 on the main menu puts the DVL into listen mode to allow a software upgrade to be transferred from an external PC to the DVL. Avoid pressing this button until the instructions in a software upgrade tell you to.
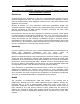
Smart Systems User’s Manual Version 1.1 5.2 Noggin Screen Overview The Noggin screen is shown in Figure 5-1. It is divided into 3 sections. The very top section (Section A) contains velocity, total depth and positioning information. The center section (Section B) contains the actual data and the bottom section (Section C) contains the menu. Each screen of data is saved in the Digital Video Logger as an individual PCX graphics file called a SPI file.
Smart Systems User’s Manual Version 1.1 5.2.1 Section A - Data Parameters Section A displays three items: 1) 2) 3) The total depth to the bottom of the data image in Section B, The velocity used to calculate the total depth and the depth lines (see Depth Lines in Section 5.2.2) and The position indicator in meters or feet (depending on the odometer units set, see Section 5.5.1 – Units).
Smart Systems User’s Manual Version 1.1 Start of Section Indicator Any time the Start button is pressed, the current date and time are written vertically on the screen to indicate the start of a new section (see Section 5.5.1 on how to set time and date on the DVL). The position indicator is also reset to zero. The current date and time can be recorded in a field notebook along with the survey location to help the user organize where each section of data was collected (Figure 5-2).
Smart Systems User’s Manual Version 1.1 5.2.3 Section C - Menu The bottom section contains the user menu selection and current program settings. This menu is described in more detail in Section 5.3. During data acquisition it also displays the current odometer position and the Repeat Trace Number that indicates if the system is moving too quickly and reducing data quality (see Section 5.4.1). 5.3 Noggin Menu Options The default menu selection is divided up into 7 sections: Exit, Print, View, Calib.
Smart Systems User’s Manual Version 1.1 Canon BubbleJet printers can usually be configured to emulate an Epson and most HP printers will work using the Laser driver. Figure 5-3: Attaching a printer to the DVL using a standard printer cable. On the back of the DVL there is a standard 25 socket parallel port. A printer can be attached to the parallel port on the DVL with a standard printer cable, just as you would attach a printer to any computer (Figure 5-3).
Smart Systems User’s Manual Version 1.1 The right edge of the plot must now be defined the same as the left, however now using the right edge of the Digital Video Logger screen. Note that the right edge cannot exceed the left edge. Next, select the type of printer attached (LASER for HP LaserJets and many other HP printers, EPSON for Epson or Canon BubbleJet printers or SEIKO for the Seiko DPU5400 Thermal printer).
Smart Systems User’s Manual Version 1.1 the user will find a data image (CART-n.PCX) file on the external computer in the current directory. When the data transfer is complete, on the external computer, exit from the WinPXFER program. Press any button on the DVL to return to the Noggin screen. 5.3.3 View Menu The View function allows the user to scroll back through previously recorded data in the same manner as the Print function (see Section 5.3.2). 5.3.4 Calib.
Smart Systems User’s Manual Version 1.1 Pressing the up, down left, right, wider and narrow buttons once makes a very small change in the position or width of the hyperbola. These buttons must sometimes be pressed many times to move the hyperbola to the correct position or width. To speed up the movement of the hyperbola, use the REPEAT button. For example, to move the hyperbola up a long distance, press the up button ( ) followed by the REPEAT button.
Smart Systems User’s Manual Version 1.1 Hyperbola Matching calibration can only be done during data acquisition. It cannot be done when viewing previously collected data. Further, the Hyperbola Matching calibration is only available after at least half a screen of data with the same depth setting have been collected. If less than half a screen of data are collected and the CALIB button is selected, only calibrations selecting a material or inputting a velocity are available (see below).
Smart Systems User’s Manual Version 1.1 If units are metres then depths will appear in metres. If units are feet then depths will appear in feet. Velocities appear in both metres per nanosecond (m/ns) and feet per nanosecond (ft/ns). To change units see Section 5.5.1 - Units. Selecting a Media If a good hyperbola or a target of known depth is not available, the user will have to estimate the velocity by selecting the predominant material in the area.
Smart Systems User’s Manual Version 1.1 5.3.5 Depth Menu This button cycles through 5 different depth ranges. The velocity of the material determined under Calibration (Section 5.3.4) affects the total apparent depth scanned. See Section 5.8.1 for more details about how depth is calculated. The Depth units can be changed to metres, feet or time in nanoseconds. For details, see Section 5.5.1 – Units.
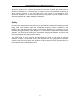
Smart Systems User’s Manual Version 1.1 Figure 5-7: Effects of the Gain setting If the user finds that they are always using very high or very low gain settings to see the data adequately, the user may want to adjust the Linear Gain setting under Setup (see Section 5.5.1 – Linear Gain). 5.3.7 Start Menu The Start button will begin the acquisition of data and displaying of data to the screen.
Smart Systems User’s Manual Version 1.1 appeared on the left. The current battery voltage will then be displayed on the left side of the screen. This battery voltage appears only briefly before starting data collection. Anytime the Start button (or Smart Handle button) is pressed, the current date and time are written vertically on the screen to indicate the start of a new section (see Section 5.5.1 – Time and Date to set time and date). The position indicator is also reset to zero.
Smart Systems User’s Manual Version 1.1 5.4 Noggin Data Acquisition Data acquisition is done simply by pushing the Smart Cart or Smart Handle system along the survey line. This is usually done with the odometer active, however, it is possible to turn off the odometer and run the Smart System in continuous operation (see Section 5.5.1 – Odometer Active). During data acquisition, the settings for Depth (Section 5.3.5) and Gain (Section 5.3.
Smart Systems User’s Manual Version 1.1 Note that Smart systems can be configured to collect data either by pushing the system (forward) or pulling the system (reverse). See Section 5.5.1 – Cart Direction about changing the system direction. The odometer should be periodically re-calibrated to ensure accuracy. The procedure for re-calibrating the odometer is described in Section 5.5.1 – Odometer Calibration.
Smart Systems User’s Manual Version 1.1 5.4.2 Collecting Data using Continuous Operation (No Odometer) It is also possible to turn off the odometer input and have the Noggin system run in continuous mode (see Section 5.5.1 – Odometer Active). This means that the system collects data even if it is not moving. This option may be the only way of collecting data when using an odometer wheel is not practical.
Smart Systems User’s Manual Version 1.1 The user is prompted to delete data when the maximum number of screens (250) has been reached. When this occurs, the user MUST delete 10%, 25%, 50%, 75% or 100% of the screens. Note that when less than 100% of the screens are being deleted, the oldest screens are deleted first. It is also possible to delete all or some of the current screens of data before 250 have been collected.
Smart Systems User’s Manual Version 1.1 5.5 Noggin Setup 5.5.1 Editing DVL Settings Pressing the number 1 on the main menu selects the SETUP item. SETUP lists the settings that can be edited in the Noggin software. Pressing the 1 button (labelled NEXT) moves forward through the list and pressing the 2 button (labelled PREV) moves backward through the list. To select a setting to edit, press the 3 button (labelled SET).
Smart Systems User’s Manual Version 1.1 displayed in time (nanoseconds). If time is selected the “depth” lines (Section 5.2.2) are actually time lines. Odometer Markers This setting determines whether a vertical dashed line is put on the data image each time a position label is written to the screen. The available options are: 1) Place a fid at each label 2) No fids at position labels (default) Odometer Calibration The odometer should be calibrated periodically to ensure accuracy.
Smart Systems User’s Manual Version 1.1 Odometer calibration values for the Smart Cart odometer should be around 4000. Odometer calibration values for the Smart Handle odometer should be around 1500. Odometer calibration values for the Vehicle odometer vary but may be around 50. Cart Direction This setting determines whether data are collected as the Smart System is pushed forward or pulled in reverse. The back up arrow (see Section 5.4.1) will work in the direction opposite to this setting.
Smart Systems User’s Manual Version 1.1 Station Interval As the Smart Cart moves, the odometer triggers the system to collect a data trace at fixed distance intervals. This interval is called the “station interval”. The station interval can be changed to allow a longer or shorter distance between traces. For a successful survey, it is important that several traces be collected over a target.
Smart Systems User’s Manual Version 1.1 Note that decreasing the station interval increases the data volume and increasing the station interval reduces the data volume. The choices available are: 1) 2) 3) 4) 5) 6) 7) 8) 9) Short Normal Long X-Long Normal x 10 Normal x 20 Normal x 40 Normal x 50 Normal x 100 Each choice listed will be followed by an actual value in metres or inches depending on which units are selected and which Noggin system is being used.
Smart Systems User’s Manual Version 1.1 Noggin 1000 System Setting Short Normal Long X-Long Norm x10 Norm x20 Norm x40 Norm x50 Norm x100 Station Interval Data per Screen 0.5 cm or 0.24 in 1.0 cm or 0.48 in 2.0 cm or 0.96 in 5.0 cm or 2.4 in 10 cm or 4.8 in 20 cm or 9.6 in 40 cm or 19.2 in 50 cm or 24.0 in 100 cm or 48.0 in 3.2 m or 12.8 ft 6.4 m or 25.6 ft 12.8 m or 51.2 ft 32.0 m or 128 ft 64.
Smart Systems User’s Manual Version 1.1 Arrow Reference Section 5.4.1 describes the Back-up Arrow that appears when a Smart System is backed up. The Back-up Arrow allows the user to pinpoint the exact ground position corresponding to a target response on the data image. The Arrow Reference value is used to change the physical position that corresponds to the Back-up Arrow. If the Arrow Reference value is set to the default value of zero (0.
Smart Systems User’s Manual Version 1.1 GPS Setup Menu The Global Positioning System (GPS) uses special satellites around the Earth to determine the position of a GPS receiver located at any position on the surface of the Earth. GPS receivers can be purchased from a number of manufacturers. The DVL has a serial port on the back for attaching a GPS receiver. This port will accommodate any GPS receiver that has a standard serial port output.
Smart Systems User’s Manual Version 1.1 Mode There are three GPS modes available: 1) Off mode means that a GPS receiver is not connected to the DVL so no GPS information is being logged. This should be the setting if you do not have a GPS receiver. 2) Display every X traces mode means that every time the Noggin collects a userdefined number of traces trace of GPR data, a data string of GPS information will be written to the data image.
Smart Systems User’s Manual Version 1.1 3) Tagging with the A Button mode means that whenever the A button is pressed during data acquisition, a data string of GPS information will be written onto the data image. For example, the data may look like this: Figure 5-10: Noggin Data with GPS information written to the screen when the A button is pressed. Baud Rate The baud rate is the speed that data is sent from the GPS receiver to the serial port of the DVL.
Smart Systems User’s Manual Version 1.1 End String The GPS receiver can be set up to send one or more types of data strings. These strings are called NMEA-0183 strings and each contains positional or other information in specific formats. Each type of string is specified by a 5-character prefix. There are numerous NMEA strings but examples of three different NMEA strings (GPGGA, GPVTG and GPGSA) are shown below. $GPGGA,134713.00,4338.221086,N,07938.421365,W,2,06,2.1,152.51,M,-35.09,M,5.0,0118*79 $GPVTG,34.
Smart Systems User’s Manual Version 1.1 System Test #2 Once the GPS system is running successfully, System Test #2 can be used to graphically display the GPS data. This screen displays the GPS Time, Latitude, Longitude and Altitude as well as other values indicating the accuracy of the GPS reading. The GPS position is also displayed in a square that can be Zoomed from 2 metres square to 16384 metres square.
Smart Systems User’s Manual Version 1.1 5.6 Noggin Buffer File Management Files collected with the Noggin system can be transferred to an external computer (Section 5.6.1) or deleted from the DVL (Section 5.6.2). 5.6.1 Transferring all Buffer Files to an External Computer using the WinPXFER Program Pressing the number 2 on the main Noggin menu transfers ALL the data buffers (up to 250 screens) from the DVL to an external computer.
Smart Systems User’s Manual Version 1.1 WARNING: To avoid damaging any of the components, turn off the DVL and computer before making any of these connections. Installing and Running the WinPXFER Program The Smart system comes with a CD-ROM containing the WinPXFER program. To install the WinPXFER program, follow the directions in the “Getting Started” document that accompanies the CD. Basically, running the SETUP.EXE program from the WinPXFER folder on the CD will install WinPXFER on the computer.
Smart Systems User’s Manual Version 1.1 Transferring Buffer Files Once the parallel XFER cable is connected (Section 5.6.1) and the WinPXFER software is installed and running (Section 5.6.1), it is now possible to transfer all data buffer files to the external computer. On the DVL, from the main menu, select number 2 – TRANSFER ALL BUFFERS. The data will be transferred from the DVL to the computer and saved in the current working directory.
Smart Systems User’s Manual Version 1.1 Viewing SPI Files in SpiView on the External PC If the buffer data transferred to the external computer are to be viewed using the SpiView software, all of the data buffer files (SPIxx.PCX) must be copied to the \SPIVIEW\BUFFERS directory. Any buffer data files in this directory should be moved or deleted before the new buffer data files are copied. Alternatively, the buffer location can be changed using the SPI_LOAD.INI file (see the SpiView Manual for details).
Smart Systems User’s Manual Version 1.1 5.8 Advanced Topics 5.8.1 How Depth is Determined Ground penetrating radar systems record the time for a radio wave to travel to a target and back. The depth to that target is calculated based on the velocity at which the wave travels to the target and back. It is calculated as: D = V x T/2 Where D is Depth (m) V is Velocity (m/ns) T is Two-way travel time (ns) The wave velocity depends on the properties of the material.
Smart Systems User’s Manual Version 1.1 6 Nogginplus 6.1 Overview of Nogginplus Menu Options The Nogginplus main menu has the following choices: A – LINE B – GRID 1 – NOGGIN PLUS SETUP 2 – FILE MANAGEMENT 3 – RUN WITHOUT SAVING DATA 4 – UTILITIES 7 – RETURN 12.1 V Rev 3.00 6.1.1 Line Survey lines collected with the Nogginplus are saved as digital data files that can be viewed on the DVL or exported to an external computer for processing and plotting.
Smart Systems User’s Manual Version 1.1 Before the data acquisition on a grid begins, the user must define the size of the area to be surveyed, the direction of the survey lines and line spacing. The details of the grid survey are specified in the Grid Setup menu option (see Section 6.3.4). 6.1.3 Setup There are many background setup parameters related to the Noggin Smart Systems operation for line and grid surveys that can be edited.
Smart Systems User’s Manual Version 1.1 6.2 Nogginplus Data Acquisition Selecting the Line, Grid or Run without Saving Data options from the main Nogginplus menu will start data acquisition. The Run without Saving Option goes straight to data acquisition while the Line and Grid options require the user to select a project number, file number and press Run before data acquisition begins. If the Auto Start option is set to ON (see Section 6.3.
Smart Systems User’s Manual Version 1.1 6.2.1 Replaying or Overwriting Data Immediately after a data file has been collected and the Stop button (or Smart Handle button) pressed, the data file can be replayed by pressing the left and right arrow buttons to the scroll the data to the left and right. As well, during data replay, the data can be enlarged or “zoomed” by pressing the Zoom button and changing the zoom factor. For example, zooming 2 times on data with a depth setting of 5.
Smart Systems User’s Manual Version 1.1 6.2.3 Section A – Position Information The very top section (Section A) contains horizontal spatial positioning information in feet or metres depending on the position units setting (see Section 6.3.1). 6.2.4 Section B - Data Display This section contains the actual data collected or replayed. The section also contains the depth indicator lines and any fiducial markers the user enters. See the sections below for more details.
Smart Systems User’s Manual Version 1.1 If a GPS receiver is attached to the DVL, a file containing GPS information can be saved. In Fuducial Tagging mode, whenever a fiducial marker is added to the data, a line of GPS information will be added to the GPS file (see Section 6.3.5) 6.2.5 Section C - Menu The bottom section (Section C) contains the user menu selection and current program settings.
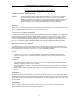
Smart Systems User’s Manual Version 1.1 Figure 6-2: Effects of the Gain setting Note that the gain setting is only for data display. The data are always saved without any gain applied. It is not possible to collect Nogginplus data with an “incorrect” gain setting. If the user finds that they are always using very high or very low gain settings to see the data adequately, the user may want to adjust the Linear Gain setting under Setup (see Section 6.3.1). 6.2.
Smart Systems User’s Manual Version 1.1 displays 6.4 metres (25.6 feet) of data for the Noggin 1000. The odometer units that appear across the top of the screen can be set to either metres or feet (see Section 6.3.1). During data acquisition, the current odometer position value (in the current units, either metres or feet) is written to the lower left corner of the screen (see Figure 6-1). Note that Smart Systems can be configured to collect data either by pushing or pulling the Noggin. See Section 6.3.
Smart Systems User’s Manual Version 1.1 This feature is useful for producing a continuous data image even if the system is backed up during the survey line. Note that it is not possible to back up and have the arrow indicator move more than one screen. The physical position corresponding to the Back-up arrow is the centre of the Noggin. This position can be changed from the centre of the Noggin to any other position. See Section 6.3.2 on changing the Arrow Offset value. 6.2.8 Calib.
Smart Systems User’s Manual Version 1.1 change in the position or width of the hyperbola. These buttons must sometimes be pressed many times to move the hyperbola to the correct position or width. To speed up the movement of the hyperbola, use the REPEAT button. For example, to move the hyperbola up a long distance, press the up button ( ) followed by the REPEAT button. The hyperbola will then start moving upward without having to press any more buttons.
Smart Systems User’s Manual Version 1.1 In Nogginplus mode, hyperbola Matching calibration can be done during data acquisition and also while viewing previously collected data. If units are metres then depths will appear in metres and velocities in metres per nanosecond (m/ns). If units are feet then depths will appear in feet and velocities in feet per nanosecond (ft/ns). To change units see Section 6.3.1 – Depth Units.
Smart Systems User’s Manual Version 1.1 If units are metres then depths will appear in metres and velocities in metres per nanosecond (m/ns). If units are feet then depths will appear in feet and velocities in feet per nanosecond (ft/ns). To change units see Section 6.3.1 – Depth Units. 6.2.9 Error Messages If an error occurs during data acquisition, an error message will appear in the bottom left section of the data acquisition screen.
Smart Systems User’s Manual Version 1.1 6.3 Nogginplus Setup Pressing the number 1 on the main menu selects the Setup item. Setup lists the various parameters that can be edited. These parameters are organized under the following headings: 12345– 6– System Parameters Cart Parameters Line Parameters Grid Parameters GPS Parameters Set Defaults To select a setting to edit, press the corresponding number button. Then use the numbered buttons to select the new setting.
Smart Systems User’s Manual Version 1.1 It is important to remember that just because the Depth setting is set to a certain value, it does not necessarily mean that the Noggin is able to penetrate to that depth and collect data. For example, if the Depth setting is 5 metres but the material penetration is only 3 metres the last 2 metres of the image will not contain subsurface information. Some materials will absorb the Noggin signal and limit penetration to less than the selected depth.
Smart Systems User’s Manual Version 1.1 Noggin System The Noggin System should be set to the type of Noggin currently in use on the Smart System. The Noggins available are: 1. Noggin 250 2. Noggin 500 3. Noggin 1000 Stacks Some materials tend to absorb radar signals and limit penetration. These materials are said to be lossy.
Smart Systems User’s Manual Version 1.1 Position Units This is the setting for the position units used by the odometer. The available options are: 1. 2. metres (default) feet 6.3.2 Cart Parameters The Cart Parameters settings allow the user to view and modify settings specific to the Smart Cart or Smart Handle system. This includes the direction the Noggin will move to collect data, whether or not the odometer is active and whether Auto Start is on or off.
Smart Systems User’s Manual Version 1.1 position corresponds with the centre point of the Noggin. However, the Arrow Offset value can be changed so that the Back-up Arrow corresponds to a position at any offset from the centre of the Noggin. For example, setting the Arrow Offset value to +0.25 metres moves the Back-up Arrow to line up with a position 25 centimetres in front of the Noggin centre point (on the Noggin 500 Smart Cart this roughly corresponds to the front axle).
Smart Systems User’s Manual Version 1.1 If a Smart Cart System is being used, select one of the two Smart Cart odometers (usually #1). If a Smart Handle system is being used, select one of the two Smart Handle odometers (usually #1). If the system is being towed behind a vehicle and using the transmission odometer to trigger the system, select one of the two Vehicle odometers (usually #1). The odometers labelled Other are to be used in future configurations.
Smart Systems User’s Manual Version 1.1 target. If the target is small, the user may want to shorten the station interval to ensure that data traces are collected over the target. Conversely, if the target is very large or is a flat-lying feature it is probably not necessary to collect a lot of traces over the target, in fact, sometimes this can make the target more difficult to see in the data. In this case it may be beneficial to increase the station interval.
Smart Systems User’s Manual Version 1.1 The choices available are: 1) 2) 3) 4) 5) 6) 7) 8) 9) Short Normal Long X-Long 10x Normal 20x Normal 40x Normal 50x Normal 100x Normal Here is a chart showing the station interval for each system and setting. The choices available are: Noggin 250 System Setting Short Normal Long X-Long Norm x10 Norm x20 Norm x40 Norm x50 Norm x100 Station Interval Data per Screen 2.5 cm or 0.96 in 5.0 cm or 1.92 in 10.0 cm or 3.84 in 25.0 cm or 9.6 in 50.0 cm or 19.20 in 100.
Smart Systems User’s Manual Version 1.1 Noggin 1000 System Setting Short Normal Long X-Long Norm x10 Norm x20 Norm x40 Norm x50 Norm x100 Station Interval 0.5 cm or 0.24 in 1.0 cm or 0.48 in 2.0 cm or 0.96 in 5.0 cm or 2.4 in 10 cm or 4.8 in 20 cm or 9.6 in 40 cm or 19.2 in 50 cm or 24.0 in 100 cm or 48.0 in Data per Screen 3.2 m or 12.8 ft 6.4 m or 25.6 ft 12.8 m or 51.2 ft 32.0 m or 128 ft 64.
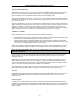
Smart Systems User’s Manual Version 1.1 Figure 6-6: Proper X Line surveying pattern. Following this pattern and starting each line from the same baseline minimizes the data editing required to produce a spatially accurate map of GPR data. Y Lines Only - Forward Set up a first-quadrant XY grid. Data lines run in the Y direction, distance increasing from the X axis baseline. Line numbers increase in the positive X direction (see Figure 6-7). Lines must be equally spaced.
Smart Systems User’s Manual Version 1.1 Figure 6-8: Proper XY grid surveying pattern. Following this pattern and starting each line from the same baseline minimizes the data editing required to produce a spatially accurate map of GPR data Survey Format The Survey Format specifies how the lines will be collected. The lines shown in Figure 6-6, Figure 6-7, and Figure 6-8 are all collected in the Forward direction only. This means that each line starts at the X or Y baseline.
Smart Systems User’s Manual Version 1.1 Y Lines Only – Forward and Reverse Using the Forward and Reverse survey format, Y line data are collected in the pattern shown in Figure 6-10. When data are collected like this, it is important that lines start and end on established baselines, otherwise, when lines are reversed to the correct orientation for the display, they may be offset from one another.
Smart Systems User’s Manual Version 1.1 Grid Dimensions For grid data acquisition, the grid size needs to be specified. The user needs to input the length of the X dimension and the length of the Y dimension. The dimensions entered are assumed to be in the same units as the Position Units (see Section 6.3.1), i.e. metres or feet. On this screen the user needs to highlight the dimension to be changed. The user can toggle between the X and Y fields by pressing the X/Y button.
Smart Systems User’s Manual Version 1.1 Note that the maximum number of lines that can be collected in each direction is 100. The calculation for determining an appropriate line spacing is complex. One has to consider system frequency, target size and practical considerations. In general, the Noggin 250 should have a line spacing of 0.5 metres or less, the Noggin 500 should have a line spacing of 0.25 metres or less and the Noggin 1000 should have a line spacing of 0.10 metres or less.
Smart Systems User’s Manual Version 1.1 Once these 4 items are set correctly you should be able to run System Test #1 and have GPS information written to the screen. When the logging of GPS information is enabled, during data acquisition a message will appear in the bottom left-hand corner of the DVL screen indicating whether GPS data is successfully being received (see Section 6.2.4).
Smart Systems User’s Manual Version 1.1 external PC (see Section 6.4.1). For example, LINE6.GPS may look like this: F1 $GPGGA,134218.00,4338.190204,N,07938.438411,W,2,05,2.6,154.60,M,-35.09,M,4.0,0118*7B $GPVTG,356.8,T,,,000.2,N,000.4,K,D*4B $GPGSA,A,3,30,10,13,24,06,,,,,,,,4.3,2.6,3.4*36 F2 $GPGGA,134219.00,4338.190294,N,07938.438409,W,2,05,2.6,154.45,M,-35.09,M,5.0,0118*7C $GPVTG,1.3,T,,,000.4,N,000.7,K,D*44 $GPGSA,A,3,30,10,13,24,06,,,,,,,,4.3,2.6,3.4*36 F3 $GPGGA,134221.00,4338.190261,N,07938.
Smart Systems User’s Manual Version 1.1 Baud Rate The baud rate is the speed that data is sent from the GPS receiver to the serial port of the DVL. The available options are: 2400, 4800, 9600 (default) or 19200. Stop Bits The available settings for Stop Bits are: 1 (default) or 2. Data Bits The available settings for Data Bits are: 7 or 8 (default). Parity The available settings for Parity are: none (default), odd or even.
Smart Systems User’s Manual Version 1.1 characters can be filled in with the necessary GPS End String. See the GPS Receiver User’s Guide for details on how to set up the receiver to output specific NMEA strings or groups of NMEA strings. System Test #1 After all the settings above have been input and the GPS receiver is attached to the serial port on the DVL, the user can test that the DVL is receiving the GPS output by using the Test option.
Smart Systems User’s Manual Version 1.1 6.4 Nogginplus File Management The File Management option is available by pressing 2 from the main Nogginplus menu. This option allows the user to export Nogginplus data or the TAGGED.GPS file (see Section 6.3.5) to an external computer using the parallel XFER cable. It is also here that the user can delete data from the DVL.
Smart Systems User’s Manual Version 1.1 document that accompanies the CD. Basically, running the SETUP.EXE program from the WinPXFER folder on the CD will install WinPXFER on the computer. Once the WinPXFER program has been installed on the computer and the user is ready to transfer data to the computer, the WinPXFER program needs to be run. This can be done using the WinPXFER shortcut on the Desktop, double-clicking the WinPXFER.
Smart Systems User’s Manual Version 1.1 One project can be highlighted and selected for export. Use the up and down arrows to highlight the project and then press the XFER button to transfer to the PC. It is also possible to use the TAG button to select several projects and export them all at once. Use the up and down arrows to highlight the projects, the TAG button to tag each project and then press the XFER button to transfer all the projects to the PC.
Smart Systems User’s Manual Version 1.1 Viewing Data Files on the External Computer After transferring data files to the external computer the Nogginplus data files can be viewed, processed and plotted using the Win_EKKO, EKKO_3D, EKKO_Mapper or EKKO_Pointer software. Appendix A contains details about the file format of Nogginplus data. 6.4.
Smart Systems User’s Manual Version 1.1 6.5 Nogginplus Utilities Pressing the number 4 on the main menu selects Utilities. This menu has utility programs to change the date and time on the DVL and also calibrate the odometer. 6.5.1 Time and Date The date and time are saved with the data files. The DVL date and time setting can be changed by moving to one or more of the appropriate fields and editing the current setting. The LEFT and RIGHT arrows are used to move between fields.
Smart Systems User’s Manual Version 1.1 When the calibration distance has been selected follow the directions on the screen: 4) Set cart at zero and press A 5) Move the cart the selected distance and press B 6) Press A to exit. Odometer calibration values for the Smart Cart odometer should be around 4000. Odometer calibration values for the Smart Handle odometer should be around 1500. Odometer calibration values for the Vehicle odometer vary but may be around 50. 6.5.
Smart Systems User’s Manual Version 1.1 7 Troubleshooting Noggin Smart Systems are designed to minimize user problems; however, all electronic devices are subject to possible failure. The following are troubleshooting hints in the likelihood of occurrence if your Smart System fails to operate. 7.1 Power Supply The most common problem that can occur while trying to run a system is insufficient power. The battery may be dead or have a low voltage.
Smart Systems User’s Manual Version 1.1 If an error occurs, an error message will appear in the bottom left section of the Noggin screen. EXIT the program and turn off the Digital Video Logger. Disconnect the power source to completely shut down the system. Make sure the cables are not damaged and that all cable connections are tightly secured. Sometimes vibrations cause the cable connections to loosen just a bit and break contact and this can cause errors.
Smart Systems User’s Manual Version 1.1 7.5 Noggin Problem When the Smart System is powered up and the user selects data acquisition in Noggin or Nogginplus mode, the Noggin system goes through a self-calibration sequence. While the self-calibration is occurring the user sees the words “Booting Noggin” in the lower left corner of the DVL screen. These words are followed by a number that counts up from 1. Normally, once the count reaches 6 the text disappears and the Noggin is ready to collect data.
Smart Systems User’s Manual Version 1.1 8 Care and Maintenance 8.1 Battery Care Smart Systems use 12-volt sealed lead acid batteries. They are fused with a 10 Amp fuse to protect them from short circuit damage. The Smart Cart battery unit uses contains a 15 Amp-hour battery. The battery unit should run the Cart Noggin for 6-8 hours before recharging is necessary. If long days of data surveying are typical, a second battery unit may be a useful item. The Smart Handle belt battery has a 7 Amp-hour battery.
Smart Systems User’s Manual Version 1.1 8.3 Skid Pads The bottom of the Noggin unit is covered with one large wear-resistant skid pad. The skid pad is designed to protrude from the bottom of the Noggin and take the majority of the abrasive wear. If the pad wears down enough, the less-resistant plastic housing may start to wear. If this occurs, it is best to replace the skid pad. It is easily removed with a Phillips screwdriver and a new one can be purchased from Sensors & Software Inc.
Smart Systems User’s Manual Version 1.1 Appendix A NOGGIN PLUS DATA FILE FORMAT Nogginplus data consists of two files, a Header file and a Data file. The files have the same name but different extensions. The format details of these files are given below. Header (.HD) File: The header file, identified by the file extension .HD, is an ASCII file. An example is shown below. The heading identifies what each piece of information represents.
Smart Systems User’s Manual Version 1.1 15 16 17 18 19 20 21 22 23 24 25 26 - 32 reserved for receiver x position reserved for receiver y position reserved for receiver z position reserved for transmitter x position reserved for transmitter y position reserved for transmitter z position timezero adjustment where:point(x)= point(x+adjustment) Zero flag: 0 = data okay, 1=zero data (not used) Time of day data collected in seconds past midnight. Comment flag: 1 = comment attached.
Smart Systems User’s Manual Version 1.1 Appendix B HEALTH AND SAFETY CERTIFICATION Radio frequency electromagnetic fields can pose a health hazard when the fields are intense. Detailed discussions on the subject are contained in the references and the web sites listed below. The USA Federal Communication Commission (FCC) and Occupational Safety and Health Administration (OSHA) both specify acceptable levels for electromagnetic fields.
Smart Systems User’s Manual Version 1.1 Appendix C FCC REGULATIONS This device complies with Part 15 of the FCC Rules. Operation is subject to the following two conditions: (1) (2) this device may not cause harmful interference and this device must accept any interference received, including interference that may cause undesired operation.
Smart Systems User’s Manual Version 1.1 Operating Restrictions Operation of this device is restricted to law enforcement, fire and rescue officials, scientific research institutes, commercial mining companies, and construction companies. Operation by any other party is a violation of 47 U.S.C. §301 and could subject the operator to serious legal penalties. FCC Interpretation of this label issued July 12, 2002 The regulations contain restrictions on the parties that are eligible to operate imaging systems.
Smart Systems User’s Manual Version 1.1 GPR Use Coordination FCC regulation 15.525(c) requires users of GPR equipment to coordinate the use of their GPR equipment as decribed below: (a) UWB imaging systems require coordination through the FCC before the equipment may be used. The operator shall comply with any constraints on equipment usage resulting from this coordination.
Smart Systems User’s Manual Version 1.1 GROUND PENETRATING RADAR COORDINATION NOTICE NAME: ADDRESS: CONTACT INFORMATION [contact name and phone number]: AREA OF OPERATION [counties, states or larger areas]: FCC ID: [e.g. QJQ-NOGGIN250 for Noggin 250 system)] EQUIPMENT NOMENCLATURE: [ e.g. Noggin 250] Send the information to: Frequency Coordination Branch., OET Federal Communications Commission 445 12th Street, SW Washington, D.C.
Smart Systems User’s Manual Version 1.1 FCC Shut Off Switch FCC regulation 15.509(c) requires that a GPR system incorporate a manually operated switch that causes the transmitter to cease operation within 10 seconds of being released by the operator. Sensors & Software GPR systems will only operate when triggered by the operator. If the system is not triggered by the operator it will cease transmitting within 10 seconds of releasing the trigger.
Smart Systems User’s Manual Version 1.1 Appendix D OPERATION OF SHUT OFF SWITCH Sensors & Software Inc.’s GPR systems transmitters will not operate in the free run mode for more than 10 seconds without the shut off switch installed and depressed by the user. Installation To install the switch, plug the 25 pin male connector into the printer port of the DVL-II or the controlling PC. Software will automatically detect the switch. Operation To operate the switch, hold the button in the closed position.
Smart Systems User’s Manual Version 1.1 References 1. Questions and answers about biological effects and potential hazards of radio-frequency electromagnetic field USA Federal Communications Commission, Office of Engineering & Technology OET Bulletin 56 (Contains many references and web sites) 2. Evaluation Compliance with FCC Guidelines for Human Exposure to Radio Frequency Electromagnetic Fields.