
User's Manual
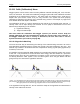
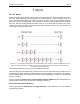
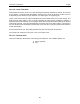
Table Of Contents
- 1 General Overview
- 2 Noggin Components
- 3 Noggin 100 Assembly
- 4 SmartCart Assembly
- 5 SmartTow Assembly
- 6 SmartHandle Assembly (Noggin 500 & 1000 only)
- 7 Rock Noggin Assembly (Noggin 500 & 1000 only)
- 8 Connecting GPS
- 9 Digital Video Logger (DVL)
- 10 Powering Up the System
- 11 Locate & Mark Mode
- 12 Survey & Map Mode
- 12.1 Survey & Map Menu
- 12.2 Data Acquisition
- 12.2.1 Replaying or Overwriting Data
- 12.2.2 Screen Overview
- 12.2.3 Position Information
- 12.2.4 Data Display
- 12.2.5 Section C - Menu
- 12.2.6 Gain
- 12.2.7 Collecting Data using the Odometer
- 12.2.8 Collecting Data in Free Run Mode
- 12.2.9 Collecting Data using the Trigger (or B) Button
- 12.2.10 Noggin Data Screens
- 12.2.11 Calib. (Calibration) Menu
- 12.2.12 Error Messages
- 12.3 Noggin Setup
- 12.4 Noggin File Management
- 12.5 Noggin Utilities
- 13 Troubleshooting
- 14 Care and Maintenance
- Appendix A Noggin Data file Format
- Appendix B Health & Safety Certification
- Appendix C GPR Emissions, Interference and Regulations
- Appendix D Instrument Interference
- Appendix E Safety Around Explosive Devices
- Appendix F Using the PXFER Cable and WinPXFER Software
- F1 Transferring Data to a PC using the PXFER Cable
- F1.1 Connecting the Digital Video Logger to a PC
- F1.2 PXFER Cable Types
- F1.3 Installing and Running the WinPXFER Program
- F1.4 Setting the DVL to the PXFER Cable Type
- F1.5 Transferring Noggin Data Buffer Files
- F1.6 Exporting Nogginplus Data
- F2 Transferring One or More Noggin PCX Files to an External PC using WinPXFER
- Appendix G GPR Glossaries

Noggin 12-Survey & Map Mode
87
DynaQ is an advanced, patented technology that dynamically adjusts stacking as the system
movement speed varies. In most situations, moving the system at a comfortable speed stacks
enough to generate data of good quality. In situations where target resolution or maximum
penetration depth is critical, moving slower increases the number of stacks and increases the
data quality.
As the system moves during data collection, the DVL screen displays a DynaQ scale bar from L
(Low) to H (high) to indicate data with enhanced signal-to-noise are being attained??.
Figure: 12-8 When collecting data with an odometer, stacking can be set to DynaQ so the number of stacks for each
trace is dynamically adjusted depending on the speed the system is moving. Moving the system slower increases the
number of stacks and increases data quality. The number of stacks is indicated on the DynaQ scale bar from Low (L)
to High (H).
The DynaQ information for each data line is written to the header (.HD) file.