
User's Manual
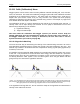
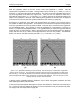
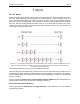
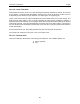
Table Of Contents
- 1 General Overview
- 2 Noggin Components
- 3 Noggin 100 Assembly
- 4 SmartCart Assembly
- 5 SmartTow Assembly
- 6 SmartHandle Assembly (Noggin 500 & 1000 only)
- 7 Rock Noggin Assembly (Noggin 500 & 1000 only)
- 8 Connecting GPS
- 9 Digital Video Logger (DVL)
- 10 Powering Up the System
- 11 Locate & Mark Mode
- 12 Survey & Map Mode
- 12.1 Survey & Map Menu
- 12.2 Data Acquisition
- 12.2.1 Replaying or Overwriting Data
- 12.2.2 Screen Overview
- 12.2.3 Position Information
- 12.2.4 Data Display
- 12.2.5 Section C - Menu
- 12.2.6 Gain
- 12.2.7 Collecting Data using the Odometer
- 12.2.8 Collecting Data in Free Run Mode
- 12.2.9 Collecting Data using the Trigger (or B) Button
- 12.2.10 Noggin Data Screens
- 12.2.11 Calib. (Calibration) Menu
- 12.2.12 Error Messages
- 12.3 Noggin Setup
- 12.4 Noggin File Management
- 12.5 Noggin Utilities
- 13 Troubleshooting
- 14 Care and Maintenance
- Appendix A Noggin Data file Format
- Appendix B Health & Safety Certification
- Appendix C GPR Emissions, Interference and Regulations
- Appendix D Instrument Interference
- Appendix E Safety Around Explosive Devices
- Appendix F Using the PXFER Cable and WinPXFER Software
- F1 Transferring Data to a PC using the PXFER Cable
- F1.1 Connecting the Digital Video Logger to a PC
- F1.2 PXFER Cable Types
- F1.3 Installing and Running the WinPXFER Program
- F1.4 Setting the DVL to the PXFER Cable Type
- F1.5 Transferring Noggin Data Buffer Files
- F1.6 Exporting Nogginplus Data
- F2 Transferring One or More Noggin PCX Files to an External PC using WinPXFER
- Appendix G GPR Glossaries

Noggin 12-Survey & Map Mode
81
12.2.11.2Identifying Air Reflections
Some hyperbolic reflections can also be caused by objects not in the subsurface such as fences,
overhead wires and, in some conditions, even large trees.
An important part of data interpretation is learning to recognize these unwanted “air” events and
differentiate them from the desired subsurface events. Good field notes are indispensable for
helping identify unwanted events on the data.
One way of identifying air reflections is to use the hyperbola fitting method. If the object is in air,
the radar velocity will be 0.3 m/ns or 0.984 ft/ns and will be much faster than if it is in the ground
(v ~ 0.1 m/ns or 0.328 ft/ns).
Figure: 12-5 Hyperbola matching can be used to identify reflections from objects that are not in the subsurface but
are from objects above ground. If the hyperbola matching velocity is near the speed of light (0.3 m/ns or 0.984 ft/ns)
then the hyperbola was caused by surface object like a overhead wire, tree, etc. After matching the hyperbola (right),
the “depth” value displayed on the bottom of the screen is really a measure of how far from the survey line the object is.