
User's Manual
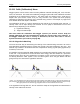
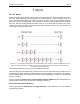
Table Of Contents
- 1 General Overview
- 2 Noggin Components
- 3 Noggin 100 Assembly
- 4 SmartCart Assembly
- 5 SmartTow Assembly
- 6 SmartHandle Assembly (Noggin 500 & 1000 only)
- 7 Rock Noggin Assembly (Noggin 500 & 1000 only)
- 8 Connecting GPS
- 9 Digital Video Logger (DVL)
- 10 Powering Up the System
- 11 Locate & Mark Mode
- 12 Survey & Map Mode
- 12.1 Survey & Map Menu
- 12.2 Data Acquisition
- 12.2.1 Replaying or Overwriting Data
- 12.2.2 Screen Overview
- 12.2.3 Position Information
- 12.2.4 Data Display
- 12.2.5 Section C - Menu
- 12.2.6 Gain
- 12.2.7 Collecting Data using the Odometer
- 12.2.8 Collecting Data in Free Run Mode
- 12.2.9 Collecting Data using the Trigger (or B) Button
- 12.2.10 Noggin Data Screens
- 12.2.11 Calib. (Calibration) Menu
- 12.2.12 Error Messages
- 12.3 Noggin Setup
- 12.4 Noggin File Management
- 12.5 Noggin Utilities
- 13 Troubleshooting
- 14 Care and Maintenance
- Appendix A Noggin Data file Format
- Appendix B Health & Safety Certification
- Appendix C GPR Emissions, Interference and Regulations
- Appendix D Instrument Interference
- Appendix E Safety Around Explosive Devices
- Appendix F Using the PXFER Cable and WinPXFER Software
- F1 Transferring Data to a PC using the PXFER Cable
- F1.1 Connecting the Digital Video Logger to a PC
- F1.2 PXFER Cable Types
- F1.3 Installing and Running the WinPXFER Program
- F1.4 Setting the DVL to the PXFER Cable Type
- F1.5 Transferring Noggin Data Buffer Files
- F1.6 Exporting Nogginplus Data
- F2 Transferring One or More Noggin PCX Files to an External PC using WinPXFER
- Appendix G GPR Glossaries

12-Survey & Map Mode Noggin
80
With the hyperbola visible on the DVL screen, select the hyperbola (
∩
) button. This will
superimpose a hyperbola on the data. This hyperbola can be moved up (!), down ("), left (#)
and right ($) using the appropriate arrow buttons. The goal is move the hyperbola until it lies on
top of the hyperbola in the data (see Figure 12-4). Then, the user can adjust the width of the
hyperbola to make it wider (#$) or narrower ($#) until the shape of the hyperbola matches the
shape of the hyperbola in the data. After matching the hyperbola, the velocity value is displayed
and now can be entered under the System Parameters (see Velocity on page 85).
Pressing the up, down left, right, wider and narrow buttons once makes a very small change in
the position or width of the hyperbola. These buttons must sometimes be pressed many times to
move the hyperbola to the correct position or width. To speed up the movement of the hyperbola,
use the REPEAT button. For example, to move the hyperbola up a long distance, press the up
button (!) followed by the REPEAT button. The hyperbola will then start moving upward without
having to press any more buttons. When it gets close to the desired location press any button to
stop it and then use the up, down, left and right buttons to fine-tune the position. The REPEAT
button can also be used after pressing the wider (#$ ) or narrower ($#) button.
(a) (b)
Figure: 12-4 Hyperbola matching to extract velocity. After pressing the CALIB button a hyperbola
appears on the screen (a). This hyperbola should be moved overtop of a hyperbola in the data using
the arrow keys. It can then be widened or narrowed to match the shape of the hyperbola in the data (b).
When the hyperbola shapes match, the velocity is extracted and displayed. The user can then use this
velocity value for surveys done in the area.
In Noggin mode, hyperbola Matching calibration can be done during data acquisition and also
while viewing previously collected data.
If units are metres then depths will appear in metres and velocities in metres per nanosecond (m/
ns). If units are feet then depths will appear in feet and velocities in feet per nanosecond (ft/ns).
To change units see Depth Units on page 85.