
User's Manual
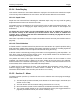
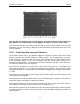
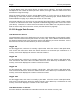
Table Of Contents
- 1 General Overview
- 2 Noggin Components
- 3 Noggin 100 Assembly
- 4 SmartCart Assembly
- 5 SmartTow Assembly
- 6 SmartHandle Assembly (Noggin 500 & 1000 only)
- 7 Rock Noggin Assembly (Noggin 500 & 1000 only)
- 8 Connecting GPS
- 9 Digital Video Logger (DVL)
- 10 Powering Up the System
- 11 Locate & Mark Mode
- 12 Survey & Map Mode
- 12.1 Survey & Map Menu
- 12.2 Data Acquisition
- 12.2.1 Replaying or Overwriting Data
- 12.2.2 Screen Overview
- 12.2.3 Position Information
- 12.2.4 Data Display
- 12.2.5 Section C - Menu
- 12.2.6 Gain
- 12.2.7 Collecting Data using the Odometer
- 12.2.8 Collecting Data in Free Run Mode
- 12.2.9 Collecting Data using the Trigger (or B) Button
- 12.2.10 Noggin Data Screens
- 12.2.11 Calib. (Calibration) Menu
- 12.2.12 Error Messages
- 12.3 Noggin Setup
- 12.4 Noggin File Management
- 12.5 Noggin Utilities
- 13 Troubleshooting
- 14 Care and Maintenance
- Appendix A Noggin Data file Format
- Appendix B Health & Safety Certification
- Appendix C GPR Emissions, Interference and Regulations
- Appendix D Instrument Interference
- Appendix E Safety Around Explosive Devices
- Appendix F Using the PXFER Cable and WinPXFER Software
- F1 Transferring Data to a PC using the PXFER Cable
- F1.1 Connecting the Digital Video Logger to a PC
- F1.2 PXFER Cable Types
- F1.3 Installing and Running the WinPXFER Program
- F1.4 Setting the DVL to the PXFER Cable Type
- F1.5 Transferring Noggin Data Buffer Files
- F1.6 Exporting Nogginplus Data
- F2 Transferring One or More Noggin PCX Files to an External PC using WinPXFER
- Appendix G GPR Glossaries

12-Survey & Map Mode Noggin
74
Figure: 12-2 Effects of the Gain setting
Note that the gain setting is only for data display. The data are always saved without any
gain applied. It is not possible to collect Noggin
data with an “incorrect” gain setting.
If the user finds that they are always using very high or very low gain settings to see the data
adequately, the user may want to adjust the Linear Gain setting under Setup (see Linear Time
Gain on page 88).
12.2.7 Collecting Data using the Odometer
As the Smart System moves, the odometer triggers the system to collect a data trace at fixed
distance intervals. This interval is called the “station interval”. For the Noggin 250, the normal
station interval is 5 centimeters (about 2 inches). For the Noggin 500, the normal station interval
is 2.5 centimeters (about 1 inch). For the Noggin 1000, the normal station interval is 1.0
centimeter (about 0.48 inch). The station interval can be changed to a longer or short distance in
the Setup (see Station Interval on page 93).
Each data trace is plotted as a vertical strip on the screen (see Figure 12-1). The width of this
strip can be changed to 1, 2, 4, or 8 pixels (see Plot Interval on page 96). The normal trace width
for Noggin 250 traces is 2 pixels while the normal width for Noggin 500 and Noggin 1000 systems
is 1 pixel.
The odometer units that appear across the top of the screen can be set to either metres or feet
(see Depth Units on page 85).
Smart Systems can normally collect data at a very fast walking pace. However, if the system is
moved too quickly, data quality is reduced (see below).
During data acquisition, the current odometer position value (in the current units, either metres or
feet) is written to the lower left corner of the screen (see Figure 12-1).
Note that Smart systems can be configured to collect data either by pushing the system (forward)
or pulling the system (reverse). See Cart Direction on page 89 about changing the direction of
data acquisition.