
User's Manual
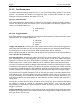
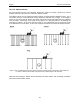
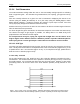
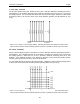
Table Of Contents
- 1 General Overview
- 2 Noggin Components
- 3 Noggin 100 Assembly
- 4 SmartCart Assembly
- 5 SmartTow Assembly
- 6 SmartHandle Assembly (Noggin 500 & 1000 only)
- 7 Rock Noggin Assembly (Noggin 500 & 1000 only)
- 8 Connecting GPS
- 9 Digital Video Logger (DVL)
- 10 Powering Up the System
- 11 Locate & Mark Mode
- 12 Survey & Map Mode
- 12.1 Survey & Map Menu
- 12.2 Data Acquisition
- 12.2.1 Replaying or Overwriting Data
- 12.2.2 Screen Overview
- 12.2.3 Position Information
- 12.2.4 Data Display
- 12.2.5 Section C - Menu
- 12.2.6 Gain
- 12.2.7 Collecting Data using the Odometer
- 12.2.8 Collecting Data in Free Run Mode
- 12.2.9 Collecting Data using the Trigger (or B) Button
- 12.2.10 Noggin Data Screens
- 12.2.11 Calib. (Calibration) Menu
- 12.2.12 Error Messages
- 12.3 Noggin Setup
- 12.4 Noggin File Management
- 12.5 Noggin Utilities
- 13 Troubleshooting
- 14 Care and Maintenance
- Appendix A Noggin Data file Format
- Appendix B Health & Safety Certification
- Appendix C GPR Emissions, Interference and Regulations
- Appendix D Instrument Interference
- Appendix E Safety Around Explosive Devices
- Appendix F Using the PXFER Cable and WinPXFER Software
- F1 Transferring Data to a PC using the PXFER Cable
- F1.1 Connecting the Digital Video Logger to a PC
- F1.2 PXFER Cable Types
- F1.3 Installing and Running the WinPXFER Program
- F1.4 Setting the DVL to the PXFER Cable Type
- F1.5 Transferring Noggin Data Buffer Files
- F1.6 Exporting Nogginplus Data
- F2 Transferring One or More Noggin PCX Files to an External PC using WinPXFER
- Appendix G GPR Glossaries

Noggin 12-Survey & Map Mode
97
12.3.4 Grid Parameters
The Grid Parameters settings allow the user to view and modify settings specific to collecting
data in organized grids. This includes the grid dimensions, line spacing, grid type and survey
format.
Data are normally collected on a grid if the user is interested in displaying the data as a 3D
volume (using the EKKO_3D software) or as a plan map (using the EKKO_Mapper and/or
EKKO_Pointer software). Producing accurate 3D volumes or plan maps is easier if the field
survey is properly designed and data are collected correctly.
Positional accuracy of each line is vital if the user wants to be able to relocate targets of interest
after the data have been processed.
For linear targets like pipes and utilities, the best GPR response occurs when the GPR survey
line crosses the target at right angles. If possible, it is always best to run GPR survey lines
perpendicular to the direction of linear targets.
For inexperienced surveyors, laying out a grid with straight lines and all corners at 90
degree angles can be difficult. Sensors & Software provides a product called EasyGrid to
make laying out an accurate grid simple. Contact Sensors & Software for more details.
12.3.4.1 Grid Type
The Grid Type asks specifically the way that the area of the grid is to be covered by the survey
lines. Survey lines can be either a set of parallel lines in the X axis direction (Figure 12-11), a set
of parallel lines in the Y axis direction (Figure 12-12), or, for complete coverage, parallel lines in
both the X and Y direction (Figure 12-13).
X Lines Only - Forward
Set up a first-quadrant XY grid. Data lines run in the X direction, distance increasing from the Y
axis baseline. Line numbers increase in the positive Y direction (see Figure 12-11). Lines must
be equally spaced. It is not critical that all the lines are the same length. However, it does make
processing easier if all the lines start at the same baseline position (usually defined as zero
(0.0)).
Figure: 12-11 Proper X Line surveying pattern. Following this pattern and starting each line from the
same baseline minimizes the data editing required to produce a spatially accurate map of GPR data.