
User's Manual
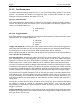
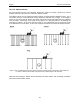
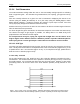
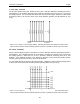
Table Of Contents
- 1 General Overview
- 2 Noggin Components
- 3 Noggin 100 Assembly
- 4 SmartCart Assembly
- 5 SmartTow Assembly
- 6 SmartHandle Assembly (Noggin 500 & 1000 only)
- 7 Rock Noggin Assembly (Noggin 500 & 1000 only)
- 8 Connecting GPS
- 9 Digital Video Logger (DVL)
- 10 Powering Up the System
- 11 Locate & Mark Mode
- 12 Survey & Map Mode
- 12.1 Survey & Map Menu
- 12.2 Data Acquisition
- 12.2.1 Replaying or Overwriting Data
- 12.2.2 Screen Overview
- 12.2.3 Position Information
- 12.2.4 Data Display
- 12.2.5 Section C - Menu
- 12.2.6 Gain
- 12.2.7 Collecting Data using the Odometer
- 12.2.8 Collecting Data in Free Run Mode
- 12.2.9 Collecting Data using the Trigger (or B) Button
- 12.2.10 Noggin Data Screens
- 12.2.11 Calib. (Calibration) Menu
- 12.2.12 Error Messages
- 12.3 Noggin Setup
- 12.4 Noggin File Management
- 12.5 Noggin Utilities
- 13 Troubleshooting
- 14 Care and Maintenance
- Appendix A Noggin Data file Format
- Appendix B Health & Safety Certification
- Appendix C GPR Emissions, Interference and Regulations
- Appendix D Instrument Interference
- Appendix E Safety Around Explosive Devices
- Appendix F Using the PXFER Cable and WinPXFER Software
- F1 Transferring Data to a PC using the PXFER Cable
- F1.1 Connecting the Digital Video Logger to a PC
- F1.2 PXFER Cable Types
- F1.3 Installing and Running the WinPXFER Program
- F1.4 Setting the DVL to the PXFER Cable Type
- F1.5 Transferring Noggin Data Buffer Files
- F1.6 Exporting Nogginplus Data
- F2 Transferring One or More Noggin PCX Files to an External PC using WinPXFER
- Appendix G GPR Glossaries

12-Survey & Map Mode Noggin
96
12.3.3.4 Plot Interval
The plot interval setting determines the width of data traces plotted to the screen. Traces can be
1, 2, 4 or 8 pixels wide.
The Normal setting for Noggin 250 systems is 2 pixels per trace and the Normal setting the
Noggin 500 and 1000 is 1 pixel per trace.
It can be useful to plot traces narrower than normal to allow more data to fit onto one screen. It
can also be useful to plot traces wider on the screen so that they are easier to see. For example,
when collecting data using the button to trigger the system (see Section 12.2.9: P.76) it is often
preferable to make each trace 4 or 8 pixels wide.
Figure: 12-10 Data traces can be plotted to the screen with a width of 1 pixel (top left), 2 pixels (top right), 4 pixels
(bottom left) or 8 pixels (bottom right). The narrower the trace width, the more data that can be plotted on one screen.
In this example, plotting the data 1 pixel wide results in 16 metres of data displayed on one screen while 2 pixels
results in 8 metres of data, 4 pixels results in 4 metres of data and 8 pixels results in 2 metres of data
Note that the Plot Interval in Noggin is strictly for display purposes on the DVL screen in real time.
The Plot Interval setting has no effect on the actual data collected and, in fact, data can be
viewed later on the DVL screen with any Plot Interval value. Similarly, data downloaded to a PC
can be plotted using any trace width.