
User's Manual
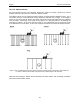
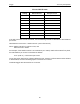
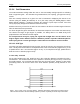
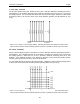
Table Of Contents
- 1 General Overview
- 2 Noggin Components
- 3 Noggin 100 Assembly
- 4 SmartCart Assembly
- 5 SmartTow Assembly
- 6 SmartHandle Assembly (Noggin 500 & 1000 only)
- 7 Rock Noggin Assembly (Noggin 500 & 1000 only)
- 8 Connecting GPS
- 9 Digital Video Logger (DVL)
- 10 Powering Up the System
- 11 Locate & Mark Mode
- 12 Survey & Map Mode
- 12.1 Survey & Map Menu
- 12.2 Data Acquisition
- 12.2.1 Replaying or Overwriting Data
- 12.2.2 Screen Overview
- 12.2.3 Position Information
- 12.2.4 Data Display
- 12.2.5 Section C - Menu
- 12.2.6 Gain
- 12.2.7 Collecting Data using the Odometer
- 12.2.8 Collecting Data in Free Run Mode
- 12.2.9 Collecting Data using the Trigger (or B) Button
- 12.2.10 Noggin Data Screens
- 12.2.11 Calib. (Calibration) Menu
- 12.2.12 Error Messages
- 12.3 Noggin Setup
- 12.4 Noggin File Management
- 12.5 Noggin Utilities
- 13 Troubleshooting
- 14 Care and Maintenance
- Appendix A Noggin Data file Format
- Appendix B Health & Safety Certification
- Appendix C GPR Emissions, Interference and Regulations
- Appendix D Instrument Interference
- Appendix E Safety Around Explosive Devices
- Appendix F Using the PXFER Cable and WinPXFER Software
- F1 Transferring Data to a PC using the PXFER Cable
- F1.1 Connecting the Digital Video Logger to a PC
- F1.2 PXFER Cable Types
- F1.3 Installing and Running the WinPXFER Program
- F1.4 Setting the DVL to the PXFER Cable Type
- F1.5 Transferring Noggin Data Buffer Files
- F1.6 Exporting Nogginplus Data
- F2 Transferring One or More Noggin PCX Files to an External PC using WinPXFER
- Appendix G GPR Glossaries

Noggin 12-Survey & Map Mode
95
N
OGGIN
1000 S
YSTEM
If the Plot Interval is not set to Normal, use the following formula to calculate the total distance
per screen:
Total Distance Per Screen = Station Interval * (640 / Plot Interval)
where: Station Interval is in metres or feet, and
Plot Interval is in Pixels.
For example, if the Station Interval is 10 centimetres (0.1 metres) and the Plot Interval is 4 pixels,
the total distance per screen is calculated as follows:
0.10 * (640 / 4) = 16.0 metres per screen
To see how much data can be collected before the DVL memory is full and data must be deleted
or downloaded, see DVL Recording Space in Section 12.5.5: P.111.
To delete Noggin data see Section 12.4.5: P.109.
Setting Station Interval Data per Screen
Short 0.5 cm or 0.24 in 3.2 m or 12.8 ft
Normal 1.0 cm or 0.48 in 6.4 m or 25.6 ft
Long 2.0 cm or 0.96 in 12.8 m or 51.2 ft
X-Long 5.0 cm or 2.4 in 32.0 m or 128 ft
Norm x10 10 cm or 4.8 in 64.0 m or 256 ft
Norm x20 20 cm or 9.6 in 128 m or 512 ft
Norm x40 40 cm or 19.2 in 256 m or 1024 ft
Norm x50 50 cm or 24.0 in 320 m or 1280 ft
Norm x100 100 cm or 48.0 in 640 m or 2560 ft