
User's Manual


13-Survey & Map Mode Noggin
106
13.3.3.4 Plot Interval
The plot interval setting determines the width of data traces plotted to the screen. Traces can be
1, 2, 4 or 8 pixels wide.
The Normal setting for Noggin 100 and 250 systems is 2 pixels per trace and the Normal setting
the Noggin 500 and 1000 is 1 pixel per trace.
It can be useful to plot traces narrower than normal to allow more data to fit onto one screen. It
can also be useful to plot traces wider on the screen so that they are easier to see. For example,
when collecting data using the button to trigger the system (13.2.9: p.87) it is often preferable to
make each trace 4 or 8 pixels wide.
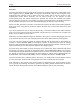
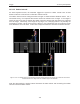
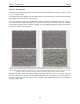
Figure: 13-9 Data traces can be plotted to the screen with a width of 1 pixel (top left), 2 pixels (top right), 4 pixels (bot-
tom left) or 8 pixels (bottom right). The narrower the trace width, the more data that can be plotted on one screen. In
this example, plotting the data 1 pixel wide results in 16 meters of data displayed on one screen while 2 pixels results
in 8 meters of data, 4 pixels results in 4 meters of data and 8 pixels results in 2 meters of data
Note that the Plot Interval is strictly for display purposes on the DVL screen in real time. The Plot
Interval setting has no effect on the actual data collected and, in fact, data can be viewed later on
the DVL screen with any Plot Interval value. Similarly, data downloaded to a PC can be plotted
using any trace width.