
Product Manual

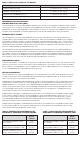
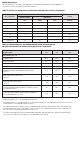
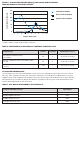


FIGURE 1. ASSOCIATION BETWEEN GRAM’S STAIN SCORE AND TEST RESULTS
FROM OSOM BVBLUE AND AMSEL CRITERIA
a
a
Gram’s stains scored using Nugent method.
(13)
TABLE 6. PERFORMANCE OF OSOM BVBLUE COMPARED TO GRAM’S STAIN
Sample Type Correct Incorrect Agreement (95% CI)
All patients tested (n=220)
(P<0.0001)
212 8 96.4% (93.9 – 98.8%)
Results in patients with BV by Gram’s Stain
(n=69)
64 5 92.8 % (86.6 – 98.9%)
Results in patients without BV Gram’s Stain
(n =151)
148 3 98.0 % (95.8 – 100 %)
CLIA WAIVER PERFORMANCE:
The OSOM BVBLUE Test was evaluated by seventy-five non-trained operators at three non-clinical
lab sites. Each operator at each site tested four samples from a randomly coded panel of strong
negative (25), weak negative (25), weak positive (25), and strong positive samples (25). Three trained
lab operators at one lab site ran all 300 samples. Agreement among non-trained operators and
known sample distribution was as follows:
TABLE 7. CLIA WAIVER PERFORMANCE OF OSOM BVBLUE
Sample (sialidase activity) Agreement
Strong Negative (0.15 U) 98.7%
Weak Negative (6.08 U) 100%
Weak Positive (9.15 U) 100%
Strong Positive (20.1 U) 100%
Cumulative Samples
BVBLUE Positive Samples
Amsel Positive Samples
30
25
20
15
10
5
0
1 2 3 4 5 6 7
8 9 10
Cumulative Test Results
Gram’s Stain Score