
Product Manual


Analytical Reactivity
Inclusivity verification was evaluated for the Silaris Influenza A&B Test. The panel consisted of 23 influenza strains. The chosen strains
represented subtypes in the population, including A: H1N1, A: H3N2, A: H1N1 (2009), B Victoria lineage strains, and B Yamagata
lineage strains. At least ten (10) Influenza A strains and five (5) Influenza B strains were included, and emphasis was placed on
contemporary strains. Virus was diluted into a Pooled clinical matrix and spiked onto a swab to create contrived swab samples. Each
strain was tested in triplicate, at final concentration of about 2x LoD of each Influenza subtype. The following test results were obtained.
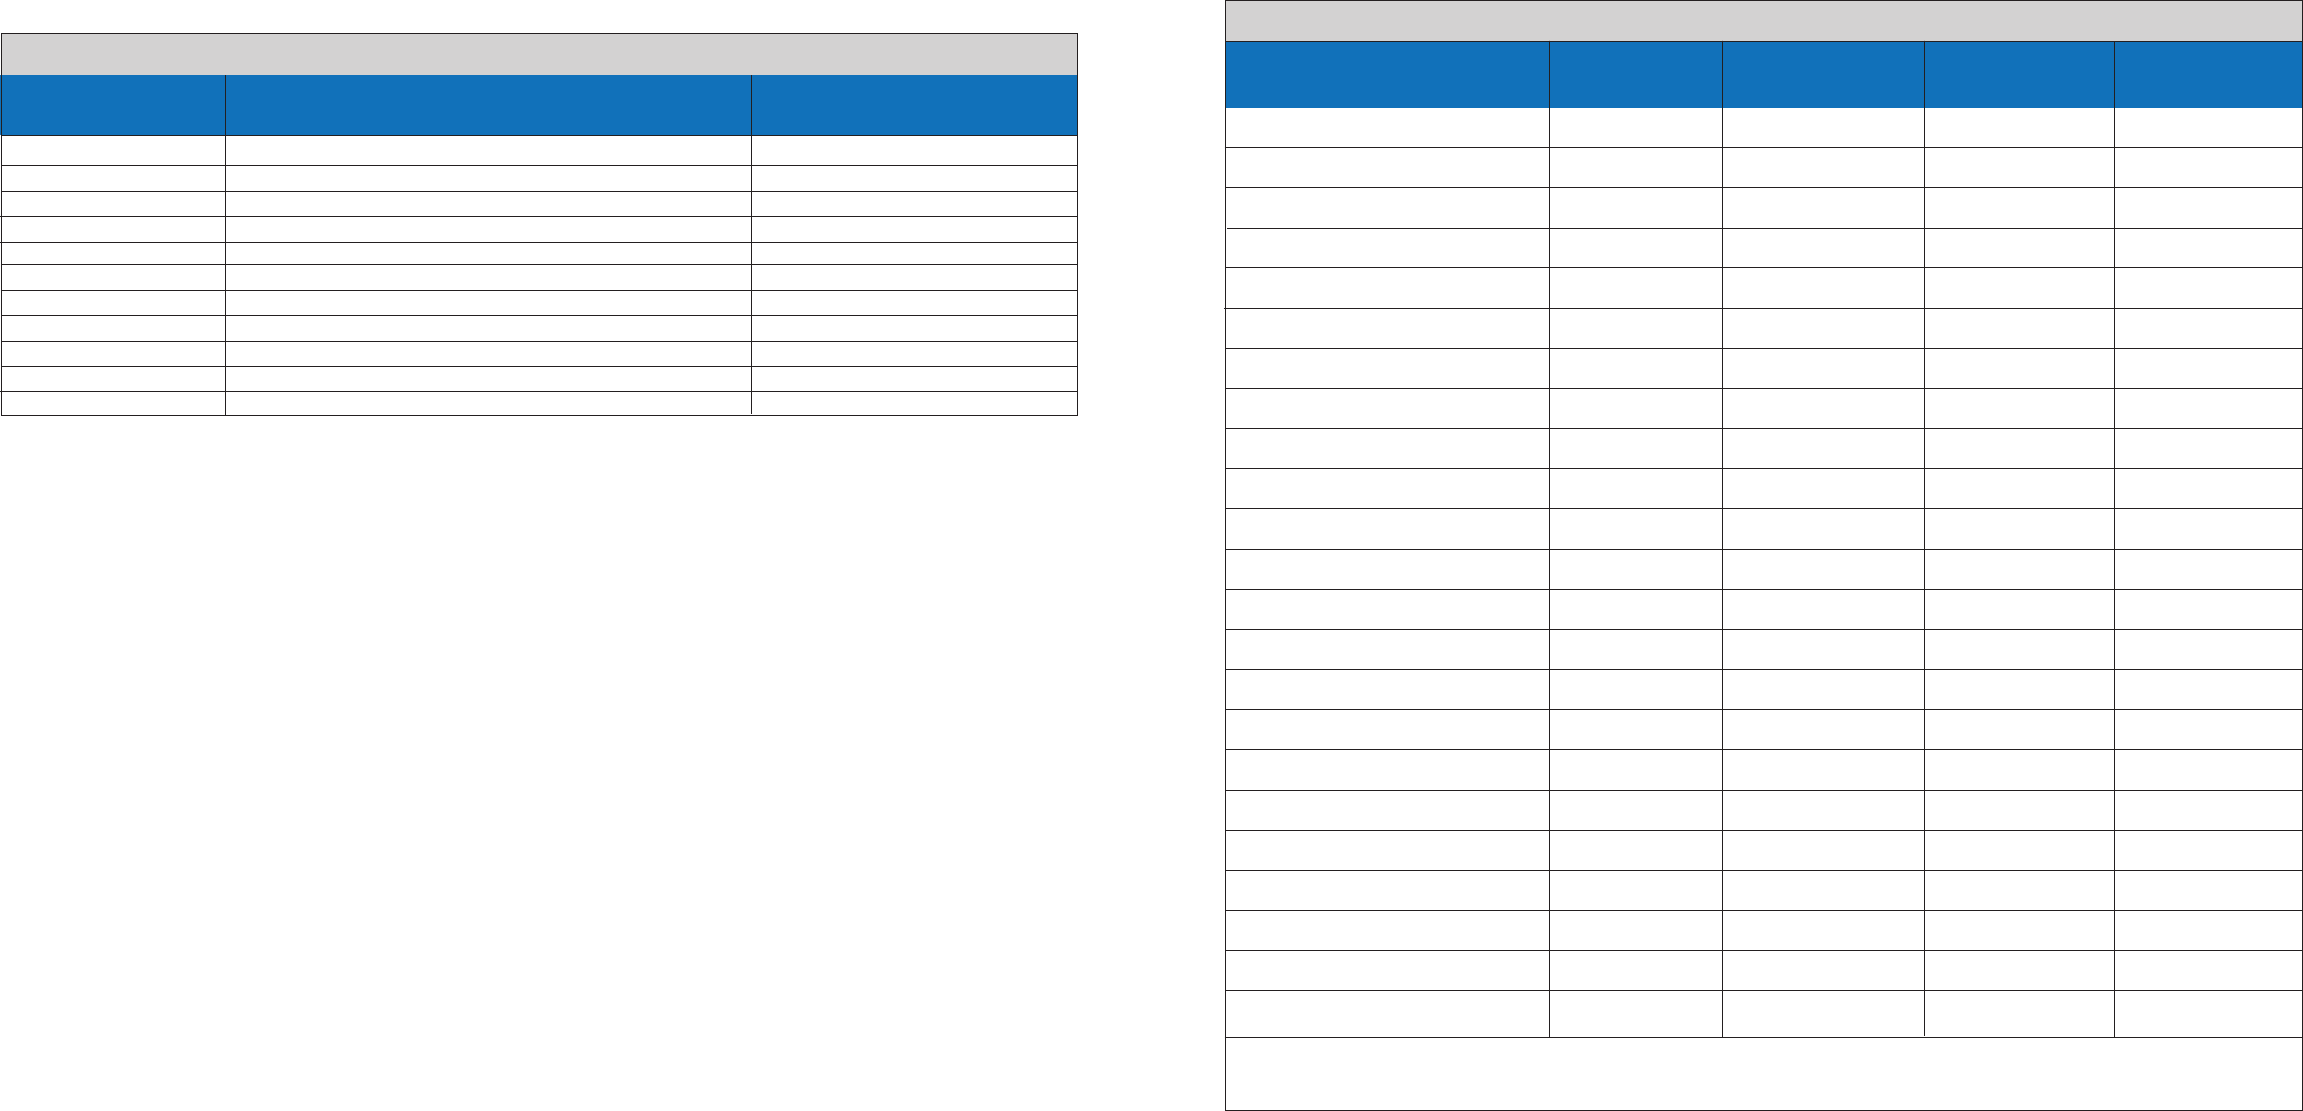
Inclusivity Verification: Influenza A and Influenza B Strains, Target Concentrations and Test Results
Influenza Strain
A/Beijing/262/1995 H1N1 6.00E+02 3/3 0/3
A/Brisbane/59/2007 H1N1 6.00E+02 3/3 0/3
A/Brisbane/10/2007 H3N2 2.40E+03 3/3 0/3
A/England/42/1972 H3N2 2.40E+03 3/3 0/3
A/Fort Monmouth/1/1947 H1N1 6.00E+02 3/3 0/3
A/New Caledonia/20/1999 H1N1 6.00E+02 3/3 0/3
A/Perth/16/2009 H3N2-like 2.40E+03 3/3 0/3
A/Port Chalmers/1/1973 H3N2 2.40E+03 3/3 0/3
A/Puerto Rico/8/1934 H1N1 6.00E+02 3/3 0/3
A/Solomon Islands/3/2006 H1N1 6.00E+02 3/3 0/3
A/Switzerland/9715293/2013 H3N2-like 2.40E+03 3/3 0/3
A/Sydney/5/1997 H3N2 2.40E+03 3/3 0/3
A/Victoria/3/1975 H3N2 2.40E+03 3/3 0/3
A/Victoria/361/2011 H3N2 2.40E+03 3/3 0/3
A/Wisconsin/67/2005 H3N2-like 2.40E+03 3/3 0/3
B/Brisbane/60/2008 Victoria 2.70E+03 0/3 3/3
B/Florida/4/2006 Yamagata 8.00E+02 0/3 3/3
B/Lee/1940 Victoria 2.70E+03 0/3 3/3
B/Malaysia/2506/2004 Victoria 2.70E+03 0/3 3/3
B/Maryland/1/1959 Yamagata 8.00E+02 0/3 3/3
B/Phuket/3073/2013 Yamagata 8.00E+02 0/3 3/3
B/Russia/1969 Yamagata 8.00E+02 0/3 3/3
B/Wisconsin/1/2010 Yamagata 8.00E+02 0/3 3/3
a
Concentration of contrived sample after 10uL of virus dilution Spiked onto Swab and Swirled in 5mL assuming 100% viral
elution recovery.
Subtype/Lineage
Viral Titer
TCID50/mL
a
Flu B Test Result
(# of FluB Positive /3)
All twenty-three (23) strains of Influenza were detected with the Silaris Influenza A&B Test at concentration of about 2x LoD.
Flu A Test Result
(# of FluA Positive /3)
Agreement of actual results with expected results was 100%. There were no significant differences observed within run (replicates
tested by one operator), between run (five different days), between sites (four sites), or between operators (eight operators).
Limit of Detection
Multiple analyte levels were tested in 20 replicates until the LoD was determined (the level at which at least 19/20 results are positive).
Four (4) influenza strains were run in replicates of twenty (20) for each concentration. The influenza strains selected for testing
included a 2009-like seasonal H1N1 influenza A strain, an H3N2 influenza A strain, and two influenza B strains representing Victoria
and Yamagata lineages. Virus was serially diluted into pooled negative clinical matrix. Only dilutions in clinical matrix were used for
LoD determination.
Limit of Detection: Observed/Expected
10 µL A/CA 300 TCID50/mL 20/20
10 µL A/CA 300 TCID50/mL 20/20
10 µL A Texas 2400 TCID50/mL 20/20
10 µL A Texas 1200 TCID50/mL 20/20
10 µL B Nevada 675 CEID50/mL 18/20
10 µL B Nevada 1350 CEID50/mL 20/20
10 µL B/MA 300 TCID50/mL 17/18
10 µL B/MA 400 TCID50/mL 20/20
Volume Spiked Swab
Final Concentration (TCID50/mL)
Observed/ Expected
Positives
The limit of detection (LoD) for the Silaris Influenza A&B Test for both Influenza A and Influenza B were determined with ≥ 95% detection at:
A/California/07/2009 (H1N1): 300 TCID50/mL B/Nevada/3/2011 (Victoria): 1350 CEID50/mL
A/Texas/50/2012 (H3N2): 1200 TCID50/mL B/Massachusetts/2/2012 (Yamagata): 400 TCID50/mL
15
16