
Product Manual


PERFORMANCE CHARACTERISTICS
Silaris Influenza A&B Test vs. Molecular Influenza Assay: Prospective Clinical Study
Clinical performance characteristics of the Silaris Influenza A&B Test were evaluated in a multi-site prospective study during the
2016-2017 flu season in the United States. A total of sixteen investigational sites throughout participated in the study. To be enrolled in
the study, patients had to be presenting at the participating study centers with flu-like symptoms. Two nasal swabs were collected from
one nostril from each subject using standard collection methods. One nasal swab was tested, following elution in 5-mL of Silaris Nasal
Swab Buffer, on the Silaris Influenza A&B Test, according to product instructions. The other nasal swab was eluted in 3-mL of viral
transport media (VTM) and transported to one of two central laboratories for testing using the comparator method, an FDA-cleared
molecular influenza assay.
A total of 1331 subjects were enrolled in this study. Of those, 73 specimens are unevaluable (i.e., failed to meet inclusion/exclusion
criteria, were not transported to a Reference Laboratory per the conditions required by the clinical protocol, had invalid results for the
comparator assay, or had two invalid results on the Silaris Influenza A&B Test). A total of 1258 specimens were considered evaluable.
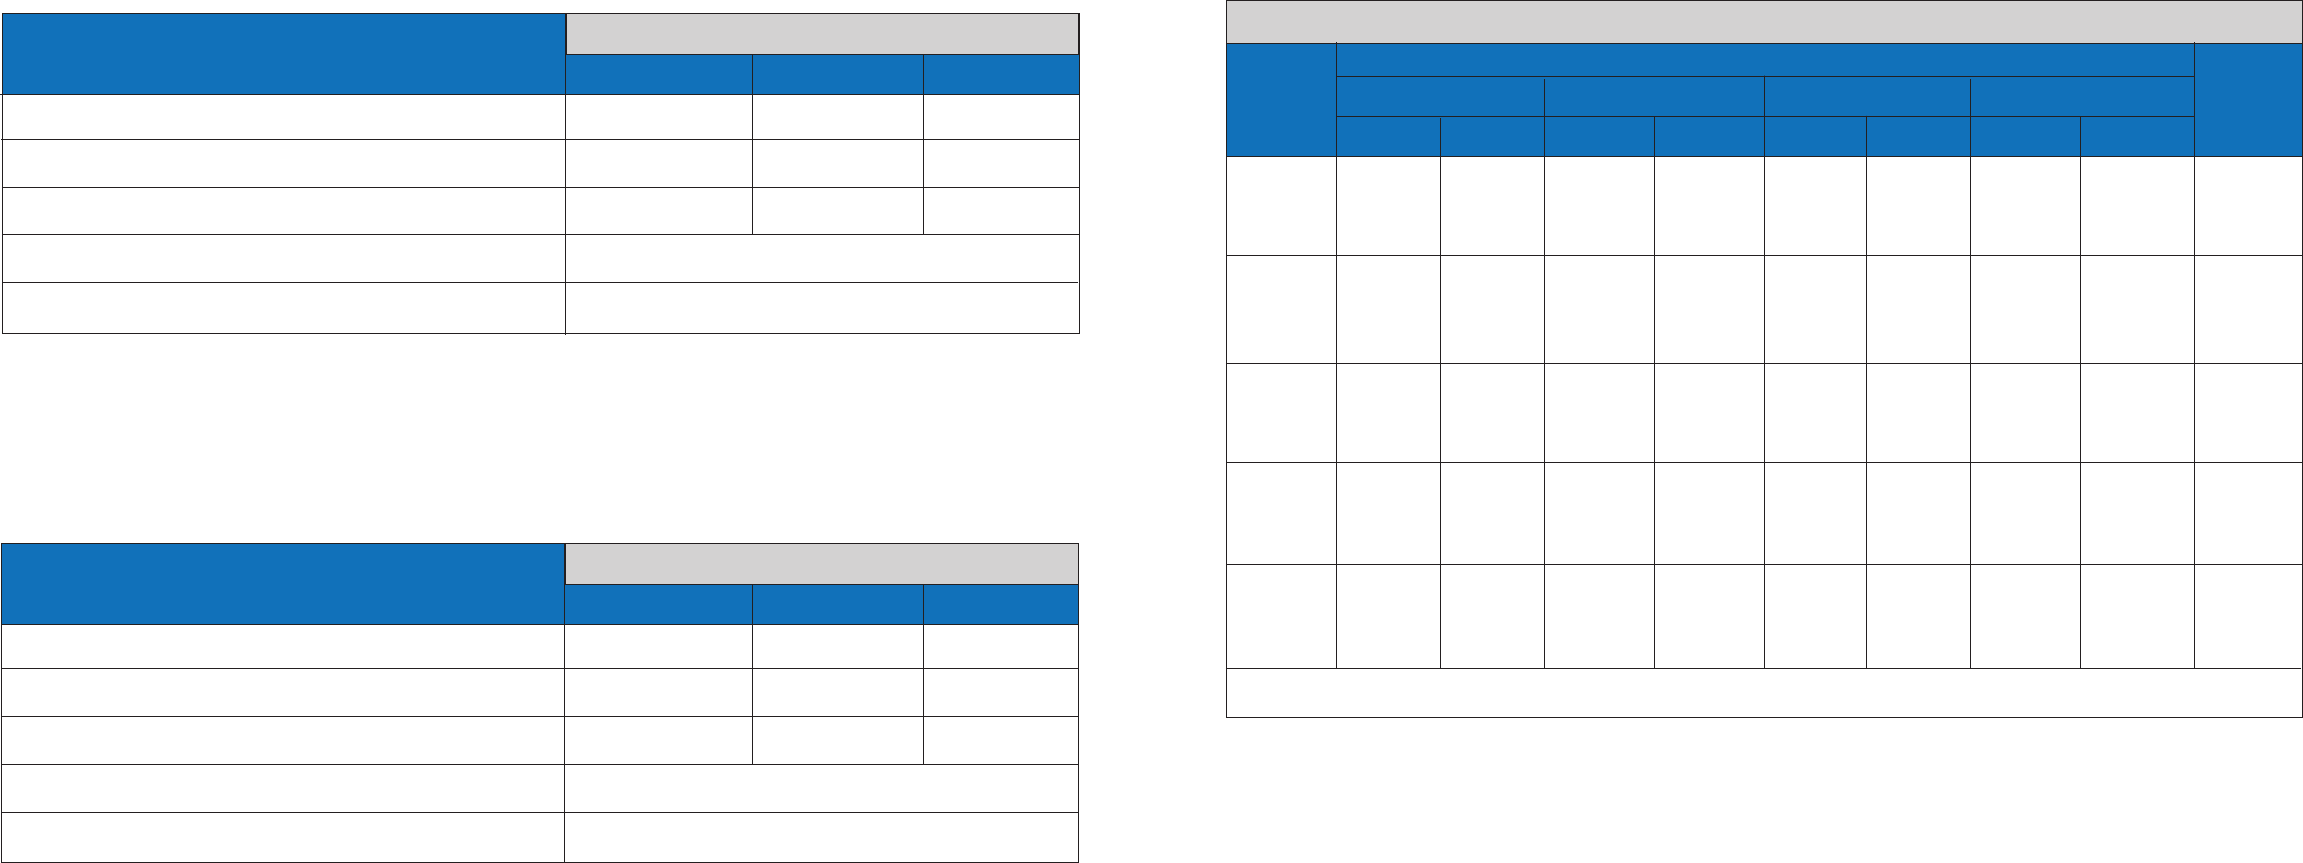
The performance of the Silaris Influenza A&B Test for influenza A and influenza B compared with the comparator method are presented
in the tables below.
Comparator
Silaris Influenza A&B
Flu A
Positive 289 60
a
349
Negative 9
b
900 909
Total 298 960 1258
Sensitivity: 97% (95% CI: 94.4% - 98.4%)
Specificity: 94% (95% CI: 92.0% - 95.1%)
Positive
Negative
Total
Silaris Influenza A&B Test Flu A performance against the Molecular Comparator Method
a
FLU A was detected in 47/60 False Positives specimens using an alternative FDA-cleared molecular Influenza Assay
b
FLU A was not detected in 3/9 False Negative specimens using an alternative FDA-cleared molecular Influenza Assay.
Comparator
Silaris Influenza A&B
Flu B
Positive 126 14
a
140
Negative 8
b
1110 1118
Total 134 1124 1258
Sensitivity: 94% (95% CI: 88.7% - 97.0%)
Specificity: 99% (95% CI: 97.9% - 99.3%)
Positive
Negative
Total
Silaris Influenza A&B Test Flu B performance against the Molecular Comparator Method
a
FLU B was detected in 9/14 False Positives specimens using an alternative FDA-cleared molecular Influenza Assay
b
FLU B was not detected in 5/8 False Negative specimens using an alternative FDA-cleared molecular Influenza Assay
Reproducibility Studies
The Reproducibility study was performed to demonstrate the reproducibility of the Silaris Influenza A&B Test with contrived nasal swabs
at three CLIA-waived sites and one moderately complex site based in the United States. The objective of this study was to test panels
of contrived nasal swab samples with the Silaris Influenza A&B Test to demonstrate reproducibility of the assay in the hands of multiple
users at multiple sites over multiple non-consecutive days.
The test panel consisted of five samples at virus concentration near the respective LoD (i.e., Flu A and B Negative, Flu A Low Positive,
Flu A Moderate Positive, Flu B Low Positive and Flu B Moderate Positive). Each sample was prepared using the influenza A and B
strains spiked into clinical matrix. The influenza A strain used in this study was Flu A/California/07/2009 and the influenza B strain used
in this study was Flu B/Massachusetts/2/2012. The targeted concentrations for the Moderate Positive samples were approximately 3X
the respective LoD, the targeted concentrations for the Low Positive samples were approximately 1X the respective LoD (C95
concentration), and the Negative samples contained no influenza virus.
Samples were provided to testing operators in panels of 5 samples (Flu A Low Positive and Moderate Positive, Flu B Low Positive
and Moderate Positive, and Negative). Samples were blinded and randomized. Each operator tested one panel per day, testing a
maximum of five samples at a time. Each sample was tested in triplicate (from separate swabs) (2 operators x 1 run x 3 swabs x 5
non-consecutive days = 30 observations for each site per sample type). Results are reported as percent agreement: actual result
/expected result x 100. Results were evaluated by site, by operator and by day. Agreement was 100% across all sites, operators and
days. Two samples did not produce results because re-tests of invalid results were invalid on re-test. Results are shown below by site.
Site-to-Site Reproducibility: Percent Agreement and Total Counts (Observed/Expected)
Sample
Category
Low Pos 100 30/30 100 30/30 100 29/29 * 100 30/30 100%,
Flu A (119/119),
(96.9%,
100%)
Mod Pos 100 29/29* 100 30/30 100 30/30 100 30/30 100%
Flu A (119/119),
(96.9%,
100%)
Low Pos 100 30/30 100 30/30 100 30/30 100 30/30 100%,
Flu B (120/120),
(96.9%,
100%)
Mod Pos 100 30/30 100 30/30 100 30/30 100 30/30 100%
Flu B (120/120),
(96.9%,
100%)
True Neg 100 30/30 100 30/30 100 30/30 100 30/30 100%
(120/120),
(96.9%,
100%)
Site
Site 1
Site 2
Site 3 Site 4
Overall %
and
95 % Cl
Count
%
Count
%
Count
%
Count
*re-run of second test resulted in an invalid
%
13
14