DL75 FlowInspector ™ (2 /0 1 /0 8) AR CH IV ED Software Guide for the DL75 Data Logger System Version 1.
8) /0 /0 1 (2 AR CH IV ED
DL75 FlowInspector™ /0 8) AR CH IV ED Software Guide for the DL75 Data Logger System (2 /0 1 FlowInspector™ Laptop Software Version 1.7 19026 72nd Avenue South • Kent, WA 98032, USA (P) 253.872.0284 (F) 253.872.0285 1.800.975.8153 www.seametrics.
/0 1 /0 8) AR CH IV ED Trademark Information (2 Copyright and All information presented in this manual is copyrighted ©2003 by SeaMetrics Flow Meters and Controls™ of Kent, WA U.S.A. All rights are reserved; no pages or information may be copied or reproduced by any means without wwritten permission from SeaMetrics. All information is proprietary, is subject to change, and should not be construed as a commitment by SeaMetrics.
Table of Contents Introduction ......................................................................... Page 1 AR CH IV ED Hardware Requirements ................................................... Page 2 Installation ............................................................................. Page 3 Using FlowInspector Software Main Screen Layout............................................................... Page 4 Logger Setup........................................................................
Introduction AR CH IV ED The FlowInspector Version 1.7 software is designed as part of the SeaMetrics DL75 Datalogger system. This software is used to set up the Datalogger and to download data files from it. It can then be used to view, graph, chart, and print the data in several formats. FlowInspector Version 1.
Hardware Requirements flowInspector requires a PC-compatible computer WITH: Windows 98, NT, 2000, or XP ■ CD-ROM drive ■ 800 x 600 or better screen resolution (recommended) ■ Serial connection port or USB/serial adapter ■ SeaMetrics DC3 data cable (2 /0 1 /0 8) AR CH IV ED ■ Hardware Requirements 2
Installation To install FlowInspector: 1. Close all other programs running on your computer. AR CH IV ED 2. Put the CD-ROM in your drive 3. If your computer is not set for autoloading, open the CD drive and run setup.exe 4. When FlowInspector is finished loading, click Next. 5. Fill in the User Information. Use the serial number from the CD case. Click Next. /0 installation directory location. 8) 6. Follow the directions to accept or to change the /0 1 7.
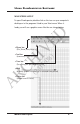
Using FlowInspector Software Main Screen Layout To open FlowInspector, double click on the icon on your computer’s desktop or in the programs listed in your Start menu. When it AR CH IV ED loads, you will see a graphic screen like the one shown below.
Logger Setup IMPORTANT: If the Data Logger has been previously in use, you must download any data you wish to save before proceeding to change set-up parameters. When you click on the Start New Session button at the end of the logger setup procedures described below, all previously stored data will AR CH IV ED be erased. First connect the data cable between the COM1 serial port of the computer and the logger, using SeaMetrics cable DC3.
Start Date / Start Time: These are the date and time that the logger was initialized, based on the real time clock of the computer used. At the end of the set up procedure below, these fields will be updated to reflect current date & time. AR CH IV ED K-factor: This is the number of pulses per gallon that the meter produces.
See the table below for the maximum number of days that the logger can hold at each cycle time setting. Data in Storage Cycle Time 11 22 45 90 180 15 30 60 120 240 (in Seconds) AR CH IV ED (in Days) If there is a flow peak in the middle of a cycle time, its maximum flow will not be recorded as such, since it will be averaged into the reading for the period. Note however that the total will be accurate /0 8) for any cycle time, since every input pulse is included in the count.
downloading from the Logger Connect the data cable from the computer to the logger. Bring up the FlowInspector main screen and click on File, then Download AR CH IV ED from Datalogger. When the data has been transferred, it will immediately show as a flow rate graph on the grid pattern. Choosing Units From the main screen, click on Show, then Units. The box below will come up.
Selecting the File to View From the main screen, click on File. Next click on Open, and select (2 /0 1 /0 8) AR CH IV ED file.
Viewing the entire file The file will appear as a graph on the main page. This is a graph of the entire period that the file includes, scaled to fit the main AR CH IV ED page grid. If the time period is long, the graph will have a spiky appearance that makes it difficult to use without scaling down to a shorter time period. The next section explains how to choose any (2 /0 1 /0 8) specific portion of the graph to study more closely.
Selecting a Time Period Select by Zoom (2 /0 1 /0 8) AR CH IV ED The simplest and most intuitve way to select a time period is by using the zoom feature. Pick the approximate start date and time desired, then click at that point on the line at the very bottom of the main grid page. When you do this, a magnifying glass icon should appear. If you hold down the left mouse key and drag to the right, a blue line will appear. Drag the end of this line to your desired end point and release.
Select by Date Entry AR CH IV ED This is the preferred method if the desired period is known exactly. Find the time bar at the top of the main grid. (See the “Main Screen Layout” illustraton on page 4 if you have trouble finding it). Enter the Start date and time and the End date and time in the appropriate boxes. Then click on the Show Period button. The selected period will immediately expand to fill the main page grid.
Viewing the selected data (2 /0 1 /0 8) AR CH IV ED To see daily totals for the selected period, click Show and then Day Report. This brings up a box that shows daily totals and maximum daily flow rate in table format. You may adjust the “From” and “To” dates to view only the records you are interested in. This report can be easily printed by clicking on the Print Report button on the box. [NOTE: If text prints off the page, check your printer settings.
EXPORTing data to spreadsheet AR CH IV ED Sometimes it is desirable to create a spreadsheet using the raw flow readings. this allows a wide variety of custom manipulation of the data. You may export the data in your choice of two formats: Excel spreadsheet or comma delimited text files (that can then be converted to an Excel spreadsheet). Exporting to Excel can take up to ten minutes or more as large amounts of data are organized into spreadsheet format.
AR CH IV ED For Comma Delimited Export: From the Day Report screen, click on Export. Select the Save in location, then under Save as type, select Comma delimited text files (*.txt). Click Save. The experienced Excel user can then import the resulting file into Excel. 8) For Excel Spreadsheet Export: From the Day Report screen, click on Export. Select the Save in location, then under Save as type, select the Worksheet Files (*.xls). Click Save.
Printing the Data (2 /0 1 /0 8) AR CH IV ED To print out a flow graph, click File and then Print or Print Preview, if you wish to see what the graph will look like before printing it. In addition to the graph, FlowInspector prints out the start and end of the time period, the logger designation, the cycle length, total flow, maximum, minimum, and average (see below).
8) /0 /0 1 (2 AR CH IV ED
8) /0 /0 1 (2 AR CH IV ED
(2 /0 1 /0 8) AR CH IV ED 19026 72nd Avenue South Kent, WA 98032 USA (P) 253.872.0284 (F) 253.872.0285 1.800.975.8153 www.seametrics.