
User guide

19
UWATEC
®
SmartTRAK
English
Zoom and pan the profile
With the help of zoom and pan buttons you can enlarge small details
in your dive profile.
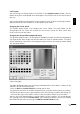
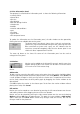
4.6 Dive Computer Display
The dive computer display shows you the face of the dive computer as it appears during the
different stages of the dive.
For dive logs imported from DataTrak a default screen is shown. Tank information is displayed
only for gas integrated computers.
For detailed information about the contents of the display(s), please refer to your dive computer
operating manual.
To make the display symbols more readable, activate the option “Smooth edges of screen
fonts” from the Windows Control Panel / Display / Appearance / Effects.
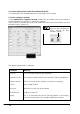
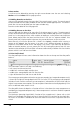
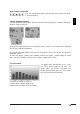
4.7 Tissue Panel
This graph shows the different tissues. Tissue
half times increase from left to right. The
graph shows the relative saturation with
respect to the ambient pressure. 100% marks
the maximum allowed saturation.
A red colour indicates on gassing.
A green colour indicates off gassing.
A purple colour indicates over saturation.