
User's Manual Part 3

Screen Service SDT 501 UB-C ARK 1-T Operations
May, 2010 v 1.0 Page 3 - 64
3.5 PRE-CORRECTION TOOL
The ARK1-T system provides a pre-correction tool for both Module & Phase and AM/PM output
signal pre-correction.
Remember to click on the Save as button the first time you change the factory default curves in
order to do not overwrite them.
Before closing the connection to port 5000, save curves changes otherwise they will be lost.
Note: the operation of uploading and downloading pre-correction curves moves a large amount
of data from and to the device. The use of these tools over low bandwidth, not stable or high
distances networks could cause frequently time-out disconnections and it is not recommended.
In order to correctly visualize Module & Phase and AM/PM windows of the GUI, the minimum
required screen resolution is 1280 by 960 pixels. For lower screen resolutions, from 1024 per
768 pixels to 1280 by 800 pixels, use either the F11 function, Full Screen option, or download
the standalone java application (executable *.jar file) through the Download Software
Standalone button sited in the General window.
3.5.1 Module&Phase
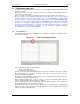
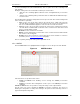
Click on MOD. PHA. button icon, highlighted in the nex figure, to modify the complex filter curves
for linear pre-correction.
Figure 15. Phase and module window
This tool provides two grids for the drawing of:
• Module of the filter’s curve.
• Group Delay of the filter’s curve.
The two curves are used to calculate the linear pre-correction coefficients. The curves are drawn
by the interpolation of 1024 points referring to the points inserted and using a linear or
polynomial interpolation algorithm.
Knob points can be added with a left-click of the mouse on the grid and deleted with a right-click,
drag and move a point to change the curve.
Each coefficient variation, due to curves change, is saved in the FPGA “runtime” memory
registers and dynamically changes the device’s output.
The tool is prevented to send an “overflowing” amount of data to the device: curve changes will
be applied only when the mouse button is released.
In the module grid, the red curve is used to monitor the current module curve calculating and
saving. The last saved coefficients are locally downloaded from the FPGA runtime memory
registers in order to redraw the curve.