
User manual


MPA-NT Software
ComTec GmbH 6-12
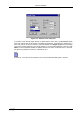
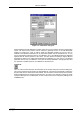
It is possible to change to a two dimensional view of the spectrum by specifying the x Dimension
and clicking the button ">> MAP" from the Single View dialog.
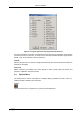
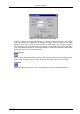
For MAP displays the Display Options dialog is changed and allows a choice between four
Graphic types: bitmap dot, vector dot, bitmap contour and vector contour. Bitmap Dot is
recommended as a standard, because it makes a good and fast display. The checkbox Invert
Roi Pixel allows to change the color inside ROI's to make it better visible. Vector Contour paints
colored contour lines. To calculate the lines takes a lot of time and causes the mouse pointer
changing to an hourglass. But it gives very impressive colored pictures suited especially for
presentation and when looking carefully at spectra details.
From the MAP View dialog it is possible to change to Single view by clicking ">> Single" or
change to Isometric View by clicking ">> Isometric".
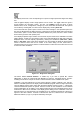
Figure 6.12: Custom-transformed spectra dialog
Figure 6.13: MAP View dialog box