
User manual


MPA-NT Software
ComTec GmbH 6-11
Display...
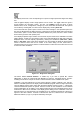
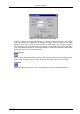
The Display menu item or the corresponding icon opens for single spectra the Single view dialog
box.
Here the graphic display mode of single spectra can be chosen. The 'Type' combo box gives a
choice between dot, histogram, spline I and line. The 'Symbol' combo box gives a choice
between None, Circle, Triangle down, Triangle up, Cross, Snow-flake and Diamond. The symbols
can be filled by checking Fill, error bars can be displayed by checking Error Bar.
'Dot' means that each spectra point is shown as a small rectangle or the specified symbol, the
size can be adjusted with the size combo box. 'Histogram' is the usual display with horizontal and
vertical lines, 'spline I' means linear interpolation between the points, and 'line' means vertical
lines from the ground to each spectra point.
If the displayed spectra range contains more channels as pixel columns are available in the video
graphic display, usually only the maximum value of the channels falling into that pixel columns is
displayed. But it can also explicitly specified by marking the checkboxes „Max Pixel“, „Mean
Pixel“ or „Min Pixel“ which value will be displayed. It is also possible to display all three possible
values in different colors that can be chosen in the colors dialog. For the „Mean Pixel“ a
Threshold value can be entered; channel contents below this value then aren't taken into account
for the mean value calculation.
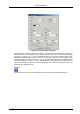
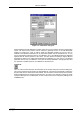
The button labeled Custom Formula... is visible only if you have a special DLL named
FMPA3.DLL. It allows to communicate with MPANT for customer- calculated spectra. This DLL
including sourcecode is now part of the DLL software interface that is available as an option.
Installation: Copy the FMPA3.DLL into the working directory (usually C:\MPA3). Use: This DLL
allows to calculate spectra and to display it with the MPANT program. Select a single spectra and
open the Display options dialog. Press then the button labeled "Custom formula...". A dialog box
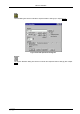
"Custom-transformed spectra" is opened. Here the formula for the calculation can be selected
and the parameters can be edited. A new display window showing the calculated spectra can be
created. Error Bars can be activated in the display options dialog, for the calculation of the error
bars also the DLL is used. Example: The supplied DLL is for acquisitions marked by a tag bit in a
high bit of the ADC interface. It allows to calculate the Sum=x+x', Difference=x-x' and relative
difference Delta=F*(x-x')/(x+x') of spectra marked by the tag bit.
Figure 6.11: Single View dialog box