
User manual


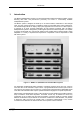

Table of Figures
ComTec GmbH VII
Figure 5.18: Sum of counts spectra before and after calibration................................................ 5-14
Figure 5.19: DLL Function Dialog ............................................................................................... 5-15
Figure 5.20: Conditions............................................................................................................... 5-16
Figure 5.21: ROI Conditions dialog............................................................................................. 5-16
Figure 5.22: Combine Conditions dialog..................................................................................... 5-17
Figure 5.23: Opening the DDE conversation with the MPA3 server in LabVIEW ...................... 5-28
Figure 5.24: Executing a MPA3 command from a LabVIEW application ................................... 5-29
Figure 5.25: Getting the total number of data with LabVIEW ..................................................... 5-30
Figure 5.26: Getting the data with LabVIEW .............................................................................. 5-30
Figure 5.27: Closing the DDE communication in LabVIEW........................................................ 5-31
Figure 5.28: Control Panel of the demo VI for LabVIEW ............................................................ 5-31
Figure 6.1: MPANT main window ................................................................................................. 6-1
Figure 6.2: MPANT Map and Isometric display ............................................................................ 6-2
Figure 6.3: File New Display dialog box........................................................................................ 6-3
Figure 6.4: Print dialog box ........................................................................................................... 6-4
Figure 6.5: Slice and rectangular ROI Editing dialog box, left: Single spectra, right: 2D
spectra ..................................................................................................................................... 6-7
Figure 6.6: Polygonal ROI Editing dialog box ............................................................................... 6-7
Figure 6.7: Single Gaussian Peak Fit ........................................................................................... 6-8
Figure 6.8: Log file Options for the Single Gaussian Peak Fit...................................................... 6-9
Figure 6.9: Colors dialog box ...................................................................................................... 6-10
Figure 6.10: Color Palette dialog box.......................................................................................... 6-10
Figure 6.11: Single View dialog box............................................................................................ 6-11
Figure 6.12: Custom-transformed spectra dialog ....................................................................... 6-12
Figure 6.13: MAP View dialog box.............................................................................................. 6-12
Figure 6.14: Isometric View dialog box ....................................................................................... 6-13
Figure 6.15: Axis Parameter dialog box...................................................................................... 6-14
Figure 6.16: Scale Parameters dialog box.................................................................................. 6-15
Figure 6.17: Calibration dialog box .............................................................................................6-16
Figure 6.18: Comments dialog box ............................................................................................. 6-17
Figure 6.19: Settings dialog box ................................................................................................. 6-17
Figure 6.20: Data Operations dialog box .................................................................................... 6-18
Figure 6.21: System Definition dialog box .................................................................................. 6-19
Figure 6.22: Spectra dialog box .................................................................................................. 6-19
Figure 6.23: Slice dialog box....................................................................................................... 6-20
Figure 6.24: Replay dialog box ................................................................................................... 6-20
Figure 6.25: Tool Bar dialog box................................................................................................. 6-21
Figure 6.26: Function keys dialog box ........................................................................................ 6-21
Figure 7.1: MPA-3 system block diagram..................................................................................... 7-2
Figure 7.2: Power connector ......................................................................................................... 7-3
Figure 7.3: I/O port connector ....................................................................................................... 7-3
Figure 7.4: Digital I/O Port Circuitry .............................................................................................. 7-4
Figure 7.5: GO Line circuit schematic...........................................................................................7-5
Figure 7.6: AUXi and REJECT circuit schematic.......................................................................... 7-6
Figure 7.7: ADC port connector assignment................................................................................. 7-6
Figure 7.8: ADC port circuit schematic ......................................................................................... 7-7
Figure 7.9: Add-on I/O port connector cable................................................................................. 7-8
Figure 7.10: Extra power supply connector cable......................................................................... 7-8
Figure 7.11: Standard 2m FHS link cable..................................................................................... 7-9
Figure 7.12: FMP bus cable.......................................................................................................... 7-9
Figure 7.13: Module power supply cable ...................................................................................... 7-9