
Manual


Monitoring System Components
975-0679-01-01 Revision D 4–17
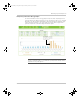
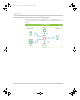
Interpreting a Solar Energy Graph 1
This graph compares PV Input energy versus energy used by the loads (Series 2).
Observation #2: This is a typical
sunny day trend.
Observation #1: Load energy
consumption is steady through
the day.
Important: This graph is from a solar grid-tied backup system and is shown for
illustration purposes only. Different systems perform variably and the graph
above may not be typical.
Conext_ComBox_Owners_Guide.book Page 17 Monday, October 21, 2013 10:00 AM