
Manual


Monitoring
4–16 975-0679-01-01 Revision D
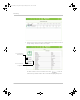
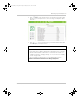
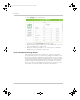
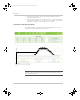
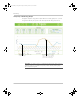
Interpreting a Grid Energy Graph
This graph compares energy that is exported back to the utility grid (Series 1) versus
energy that is taken by the system on the same day from the utility grid (Series 2).
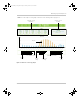
Observation #2:The sun is shining
and the solar harvest is yielding
enough surplus energy that the
system is able to sell to the grid.
Observation #1: The system takes
energy from the grid.
Important: This graph is from a solar grid-tied backup system and is shown for
illustration purposes only. Different systems perform variably and the graph
above may not be typical.
Conext_ComBox_Owners_Guide.book Page 16 Monday, October 21, 2013 10:00 AM