
Manual


Monitoring System Components
975-0679-01-01 Revision D 4–15
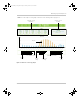
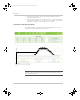
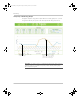
Interpreting a Load Energy Graph
This graph compares energy consumed by system loads versus energy received from
the utility grid.
Observation #1: The loads
are receiving pass-through
energy from the grid.
Observation #2: How can the system continue to power the loads when there is no more grid
input? It is still possible because the system also receives power from the sun. And during this time
when the sun is up, the system collects energy and supplies it to the loads.
Important: This graph is from a solar grid-tied backup system and is shown for
illustration purposes only. Different systems perform variably and the graph
above may not be typical.
Conext_ComBox_Owners_Guide.book Page 15 Monday, October 21, 2013 10:00 AM