
Manual


Monitoring System Components
975-0679-01-01 Revision D 4–13
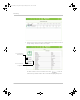
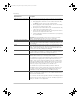
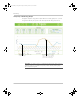
To open a graph and use its interactive features:
1. Click any system component from the menu bar, except Devices. The system
component’s energy graph opens.
• To open an information bubble on an object, hover the mouse pointer on
the object.
• To change the time reference of Series 1 (or Series 2), click the left and
right buttons to move backward and forward in time, respectively.
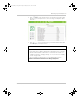
• To change Series 1 (represented as orange), click the Series 1 drop
down button and select a data set. If Series 1 only has one data set then
the drop down button disappears.
To change Series 2 (represented as blue), click the Series 2 drop down
button and select a data set you want to compare with Series 1.
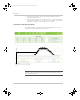
2. To change the graph type setting to a line graph, select the Line Graph check
box.
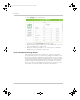
Interval Setting The interval setting changes the Y-axis label to one of four choices:
Hours, Days, Months, or Years.
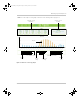
Graph Type Setting By default, the graph displays bars. You have the option to display a
line graph simply by selecting the check box next to the Line Graph.
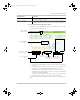
Graph Element Description
In this example,
Grid is selected
information bubble on
mouse-over
click to move forward/
backward in time
click the link to
open the calendar
selector app
click to change the
data set
click to change
the X-axis
click to change
the bar graph to
a line graph
Conext_ComBox_Owners_Guide.book Page 13 Monday, October 21, 2013 10:00 AM