
Manual


Monitoring
4–10 975-0679-01-01 Revision D
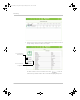
6. Click in the left side menu.
You will see a list of Device Settings for that type of device.
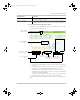
7. Before making any changes, put the device on standby mode. See “To set a
device in Standby mode:” on page 3–30.
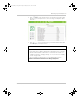
8. Change the settings accordingly. See “To change a Device Setting after
putting the device on Standby:” on page 3–32.
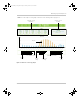
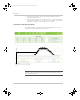
System Component Energy Graphs
Each of the system components, except Devices, generates an interactive
energy graph that allows you to monitor energy readings of the Battery, Loads,
Grid, Solar, and Generator. Aggregate energy information collected on a daily,
weekly, monthly, and yearly basis can be displayed for each of the components
using bar and line graphs. Using the graphs as an aid, you can analyze your
system’s performance and maximize its energy consumption. You can make
decisions on effective load management, find areas for energy efficiency, and
develop plans for selling any surplus energy back to the utility grid.
Conext_ComBox_Owners_Guide.book Page 10 Monday, October 21, 2013 10:00 AM