
Technical information


3/21
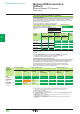
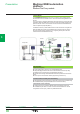
Modicon M580 automation
platform
Embedded web pages
Presentation (continued)
Performance
Port Statistics
I/O Scanner
Diagnostic web pages (continued)
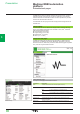
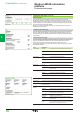
Performance page
The objects on this page provide information on performance statistics.
Field Description
Error Statistics This area contains the detected errors in the diagnostics data for the CPU
(these counters can be reset to 0 with the Reset Counters button)
Error Rate This percentage represents the total number of packets divided by the
number of packets that are not associated with detected errors
Total Bandwidth
Utilization
This value indicates the percentage of the available bandwidth that the
CPU is using
Module I/O
Utilization
This graph shows the total number of packets (per second) the CPU can
handle at once (1)
Processor
Utilization
This graph shows the number of Modbus/TCP or EtherNet/IP messages
per second for the client or server (1)
System Bandwidth
Monitor
These graphs show the percentage of bandwidth consumed by the
Modbus messaging and I/O Scanning services (1)
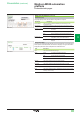
Port Statistics page
This page shows the statistics for each port on the CPU.
This information is associated with the conguration of the Ethernet ports and the
conguration of the service/extended port.
The names of active ports are green. The names of inactive ports are gray.
The information is reset or expanded with these buttons:
b Reset Counters: Resets all dynamic counters to 0.
b Detail View: Expands the list of port statistics.
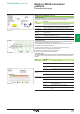
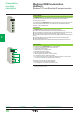
I/O Scanner page
The objects on this page provide information on the scanner status and connection
statistics.
Field Description
Scanner Status Enabled The I/O scanner is enabled
Disabled The I/O scanner is disabled
Idle The I/O scanner is enabled but not running
Unknown The I/O scanner returns unexpected values from the
device
Connection
Statistics
Transactions per second
Number of connections
Scanned Device
Status
Colors that appear in each block indicate these states for specic remote
devices
Gray There is an uncongured device
Black The scanning of the specic device has been
intentionally disabled
Green A device is being scanned successfully
Red A device that is being scanned is returning detected
errors
(1) Move the mouse over the dynamic graphs to see the current numeric values.
2
1
3
4
5
6
7
8
9
10
2
1
3
4
5
6
7
8
9
10