
Hardware reference guide


Ethernet Modules
35013379 02 October 2007 333
Results are returned as percentages. CPU time spent in other services is shown as
"Other" or "Free." Bandwidth Monitoring uses the same functions as used by SNMP.
The three service rates, Global Data, I/O Scanner, and Messaging, are computed
using the following formula:
(Current load * 100) / Maximum Load
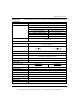
Table of Maximum Load Rates
The current load is computed dynamically.
Enhanced Web
Diagnostics
The embedded Web server provides Web pages that you may use to diagnose
Transparent Factory / Real Time services.
Those diagnostic services are listed below:
1. Global Data diagnostics
z Status of all Global Data services
z Status of all subscribed and published variables
z Publication / Subscription rate
2. I/O Scanning diagnostics
z Status of all I/O Scanning services
z Status of individual scanned devices
z Actual I/O scanning rate
3. Messaging diagnostics
z Diagnostic information for Port 502 messaging
4. Bandwidth Monitoring
z Throughput measurement of NOE by service
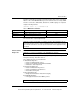
Diagnostic Service Workload Data Returned Maximum load for NOE 771 x1
Global Data Number of published variables per second 800
I/O Scanner Number of transactions per second 4200
Messaging Number of messages treated per second 410
Note: The loads are dependent on controller scan time. Each application has an
expected scan time. Therefore, when evaluating the loads, you should ensure that
the controller scan time is set to the expected scan time for the application being
modelled.
Note: These services are available on the 140NOE771x1 modules.
Note: All these pages are protected by the general HTTP password.
This document provided by Barr-Thorp Electric Co., Inc. 800-473-9123 www.barr-thorp.com