PM180 PM180 Series SUBSTATION AUTOMATION UNIT OPERATION MANUAL BG0525 Rev.
LIMITED WARRANTY The manufacturer offers the customer a 24-month functional warranty on the instrument for faulty workmanship or parts from date of dispatch from the distributor. In all cases, this warranty is valid for 36 months from the date of production. This warranty is on a return to factory basis. The manufacturer does not accept liability for any damage caused by instrument malfunction.
Chapter 1 Introduction Controls and Indicators Table of Contents Chapter 1 Introduction ........................................................................... 7 expertmeter™ PM180 Features ............................................................................................ 7 AC/DC Inputs..................................................................................................................... 9 Digital and Analog I/O module Options.................................................
Monitoring ...................................................................................................................22 Substation Battery ............................................................................................................ 22 Memory Backup Battery .................................................................................................... 22 Power Supply .................................................................................................................
Chapter 1 Introduction Chapter 5 Controls and Indicators Using Telnet ........................................................................ 46 Connecting to the Device ...........................................................................................46 Running Telnet from HyperTerminal .................................................................................. 46 Running the Telnet Client on Windows 2000 and Windows XP ..............................................
Configuring the Waveform Recorder ........................................................................87 Configuring the IEEE 1159 Power Quality Recorder ...............................................89 Configuring the EN50160 Power Quality Recorder .................................................92 EN50160 Background ....................................................................................................... 92 Evaluation Techniques .........................................................
Chapter 1 Introduction Controls and Indicators Retrieving EN50160 Statistics Files ................................................................................... 127 Viewing Historical Data On-line ........................................................................................ 127 Chapter 14 Viewing Log Files ........................................................... 129 General Operations...................................................................................................
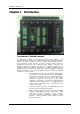
Chapter 1 Introduction Chapter 1 Introduction expertmeter™ PM180 Features The expertmeter™ PM180 Series intelligent electronic devices (IED) in a 3U standard form factor design, are combined fault-recording, metering and control devices that provide a complete solution for substation and industrial automation. They incorporate a unique collection of features commonly found in numerous specialized measurements and recording equipment utilized in substation and industrial environments.
Chapter 1 Introduction 8 Controls and Indicators EN 50160 Power Quality recorder: onboard power quality analyzer; programmable limits; EN 50160 power quality event log, EN 50160 compliance statistics; EN 50160 harmonics survey statistics; ready-for-use compliance statistics reports; power frequency, voltage variations, rapid voltage changes, IEC 61000-4-15 flicker, voltage dips, interruptions, temporary overvoltages, transient overvoltages, voltage unbalance, IEC 61000-4-7 harmonic and interharmonic v
Chapter 1 Introduction AC/DC Inputs The PM180 is provided with a set of fully isolated AC/DC inputs for connecting to the AC feeders or station battery: Three isolated AC voltage inputs (up to 690VAC direct line-toline input voltage) Four standard isolated AC current inputs with an extended input range up to 2000% overload (10A/20A input currents, to 100 Amps fault currents) One AC/DC voltage input (up to 400VAC/300VDC) for monitoring the station battery Digital and Analog I/O module Options The
Chapter 1 Introduction Controls and Indicators up to five non-intrusive simultaneous connections, Telnet service port) IEEE 802.11b/g backup wireless Ethernet port - WiFi (MODBUS/TCP, DNP3.0/TCP and IEC 61850 protocols, up to five non-intrusive simultaneous connections, Telnet service port) PROFIBUS DP IRIG-B for GPS time synchronization Remote Displays The PM180 can be ordered with a LED Remote Display Module (RDM180) or an LCD Remote Graphical Module (RGM180).
Chapter 1 Introduction Supplemental Documents BG0521 PM180 Installation Manual BG0527 PM180 MODBUS Reference Guide BG0524 PM180 DNP3 Reference Guide BG0523 PM180 IEC 61850 Reference Guide BG0xxx PM180 Bay Controller Unit – Application note BG0337 PAS Getting Started Guide PM180 Substation Automation Unit 11
Chapter 2 Device Description Controls and Indicators Chapter 2 Device Description Controls and Indicators Device Controls The PM180 is entirely controlled either from the remote display module (RDM or RGM), or by using the supplemental PAS power analysis software package.
Chapter 2 Device Description Communicating with the PM180 Service Mode Service Mode is used for local upgrading of PM180 firmware. When the device enters Service Mode, the CPU LED briefly flashes 2 times with a 1-second pause. In Service Mode, all device operations are stopped. Diagnostics Mode The device enters Diagnostics Mode when the internal diagnostics detects a critical error that affects the normal device operation. All device operations are stopped until the critical error is cleared.
Chapter 2 Device Description Communicating with the PM180 Embedded 56K modem for communications through public telephone lines (MODBUS RTU/ASCII and DNP3.0 protocols). Embedded Cellular modem for communication through public cellular network (MODBUS/TCP and DNP3.0/TCP) PROFIBUS DP USB Port (standard) A USB node port is intended for local communications with the support PAS software. It is directly connected to your PC’s USB port using the supplied USB cable.
Chapter 2 Device Description Device Inputs The remote display modules communicate with the PM180 using the MODBUS RTU protocol. Both the COM3 port and the RDM/RGM RS-485 port are preset at the factory to 19200 bps, 8-bits/No-parity, address 1, and run the MODBUS RTU protocol. The baud rate can be increased up to 115200 bps (depending on the communications quality) through the RDM or service Terminal program.
Chapter 2 Device Description Device Outputs unlimited number of post-event cycles. The length of the captured waveforms is only restricted by the size of the allocated logging memory. VDC Input One high-impedance DC voltage input (300VDC range) V4, is normally intended for monitoring the substation battery. It is sampled at a rate of 2 samples per cycle (each 8 or 10 ms) and synchronized to the AC sampling circuitry.
Chapter 2 Device Description Device Outputs supply. The AI modules may be ordered with 0-1mA, ±1mA, 0-20mA, or 4-20mA output current. The 0-1mA and ±1mA analog outputs provide 100% overload currents up to 2 mA and ±2mA. Update time for analog outputs is 2-cycles (32 ms at @ 60Hz and 40 ms @ 50Hz). Each analog output can be independently scaled to provide the desired engineering scale and resolution (see Programming Analog Outputs in Chapter 7).
Chapter 2 Device Description Metering release command. The remote release command also removes the local commands that hold a latched relay in active state. A remote operate command sent to a pulse or KYZ relay forces the relay to produce a pulse or changes its state. A remote release command sent to a pulse or KYZ relay has no effect since the operate command is cleared automatically for these relays. Retentive Relays Latched relays can be set to operate in retentive mode.
Chapter 2 Device Description Metering Harmonic Measurements The PM180 provides harmonic measurements on four voltage channels V1-V4 and four standard range (20A/10A) current channels I1-I4. To avoid erroneous harmonic readings when the high fault currents saturate current channels, the harmonics registers are not updated at the time of the fault. The FFT analysis is performed over a 10-cycle waveform for 50Hz and 12-cycle waveform for 60Hz system, sampled at a rate of 128 samples per cycle.
Chapter 2 Device Description Metering The device provides individual voltage and current harmonic measurements both in percent of the fundamental component, and in corresponding engineering units. Quantities in engineering units are calculated only for odd harmonics. Angles for phasor vectors are given relative to the V1 phase voltage. Aggregation Intervals The device provides electrical measurements using a number of fixed aggregation time intervals from 1/2 cycle to 2 hours.
Chapter 2 Device Description Metering The accumulated demand represents the relative energy accumulated from the beginning of the present demand interval and expressed in power units. It grows from zero at the beginning and up to the final block demand at the end of the demand interval. If the accumulated demand exceeds the allowed demand at any point, the final block interval demand is more than the present accumulated demand (or equal if the load is disconnected).
Chapter 2 Device Description Monitoring The energy pulse LEDs are used for testing device accuracy by the external control equipment through pulse readers. In order not to affect the energy accumulators, the device should be put into the Energy Test Mode where the energy accumulators are disconnected from the power sources. Energy Test Mode also prevents erroneous setpoint operation and recording faults and power quality events when the test volts and currents are applied to the device.
Chapter 2 Device Description Recording The logical controller launches the Waveform recorder and Data recorder to record the input waveforms and measured quantities at the time of the event. Control setpoints can also be linked to the Event recorder and Sequence-of-Events recorder to record setpoint transition events into the event log files.
Chapter 2 Device Description Device Diagnostics aligned time synchronization pulses through relay contacts connected to DI1-DI48 PM180 digital input, or from the Ethernet network using SNTP protocol. The PM180 IRIG-B port uses unmodulated (pulse-width coded) time code signal (unbalanced 5V level). For more information on time synchronization in your device and IRIG-B operation, see Time Synchronization Source in section Local Settings, Chapter 7.
Chapter 2 Device Description Device Diagnostics NOTE The IRIG-B time faults may not be masked and may not be cleared externally. If the IRIG-B time code signal is not provided, set the device time synchronization input to any unused digital input (see Local Settings in Chapter 7) to avoid fault alarms caused by the IRIG-B port.
Chapter 3 Using the RDM Connecting the RDM Chapter 3 Using the RDM Connecting the RDM diSP Con.Err. Connect the RDM to the PM180 COM3 port using the supplied cable as shown in the PM180 Installation Manual. When the PM180 is powered, the RDM display lights up. The COM3 and RDM communications settings must match one another. Both the COM3 port and the RDM RS-485 port are factory preset to 19200 bps, 8-bits/noparity, device address 1, Modbus RTU protocol.
Chapter 3 Using the RDM Data Display When wiring via PT is used, the PT ratio up to and including 4.0, voltages are displayed in volts, and power in whole kilowatts. For the PT ratio above 4.0, voltages are displayed in kilovolts, and power in megawatts with three decimal places. Currents are displayed in amperes with two decimal places. Primary and Secondary Volts Volts are displayed in primary (default) or secondary units.
Chapter 3 Using the RDM Data Display Pressing both the UP and DOWN arrow keys together returns to the first page within the current display. The common measurements display (main screen) does not have an indicator LED. If no LED is lit up below the display, this means that the common measurement parameters are being displayed at this time. To return to the common measurements from another display, just press the same key (the key pointed to by an illuminated LED) until the illuminated LED goes out.
Chapter 3 Using the RDM Data Display Page Label Parameter 14 Ph.L3 Power factor L3 kW L3 kVA L3 Ph.
Chapter 3 Using the RDM Data Display Page Label Hi 9 Hd 10 Hd 11 Hd Parameter Units LED Maximum total kvar Maximum volt demand V1/V12 Maximum volt demand V2/V23 Maximum volt demand V3/V31 Maximum ampere demand I1 Maximum ampere demand I2 Maximum ampere demand I3 Maximum sliding window kVA demand Power factor (import) at maximum kVA demand Maximum sliding window kW import demand kvar/Mvar V1/V1-2 - kV1/kV1-2 V2/V2-3 - kV2/kV2-3 V3/V3-1 - kV3/kV3-1 A1 A2 A3 kVA/MVA PF kW/MW Power Quality Display Press
Chapter 3 Using the RDM Status Information Display Page Label Parameter Units LED Mvarh 6 EP. Mvarh export U-h 7 Volt-hours A-h Ampere-hours Status Information Display The RDM has separate status information pages accessible through the MAIN RDM menu. For information on navigating in the RDM menus, see “Using the Menus”. To enter the Status Information Display: 1. From the Data display, press SELECT to enter the Main Menu. The “STA” window flashes. 2.
Chapter 3 Using the RDM Using the Menus Resetting Counters When changing data is not password protected, you can reset the counters from the Status Information Menu display without entering the reset menu: 1. Select a display page where the counter you want to reset is displayed. 2. While holding the SELECT key, press and hold the ENTER key for about 5 seconds until the displayed data is reset to zero.
Chapter 3 Using the RDM 1. 2. Configuring the RDM If the StA window is not a current active window, use the SELECT key to activate it. Press the SELECT key to enter the Status Information Display For viewing the RDM or the PM180 setup options: 1. 2. Press the SELECT key to activate the OPS window. Press the SELECT key to enter the Setup Options Menu. To change the RDM or the PM180 setup, or to clear the accumulated values: rESEt 1. 2. ESC Press the SELECT key to activate the CHG window.
Chapter 3 Using the RDM Configuring the PM180 Label Option Range Default Description Updt Update rate 0.1-10.
Chapter 3 Using the RDM Configuring the PM180 Label Option Format/Range date Date YY.MM.DD, MM.DD.YY, DD.MM.YY dAY Day of week dSt Daylight savings time option Sun = Sunday on = Monday tuE = Tuesday UEd = Wednesday thu = Thursday Fri = Friday Sat = Saturday diS = disabled En = enabled dSt.S DST start date Month-weekweekday Week = 1st, 2nd, 3rd, 4thor LSt (last week of the month) dSt.
Chapter 3 Using the RDM Configuring the PM180 Label Option ConF Pt1 Wiring connection mode See Table 4Ln3 (configuration) below V1-V3 PT ratio 1.0 - 6500.0 1.0 Pt.SEc V1-V3 PT secondary 10 - 690 V Pt.41 V4 PT ratio 1.0 - 6500.0 Pt.4SEc V4 PT secondary 10 - 690 V Ct2 I1-I3 CT primary current 1 - 10000 A Ct.SEc2 Ct.42 I1-I3 CT secondary current I4 CT primary current Ct.4SEc2 I4 CT secondary current 1, 5 A Ct.E.
Chapter 3 Using the RDM 2. 3. Configuring the PM180 Use the Up/Down arrow keys to set the desired option. Press ENTER to confirm your changes and to store your new setting, or press ESC to discard changes. To exit the menu: From the middle window, press ESC or ENTER. Notes 1. Always specify the wiring mode and transformer ratings prior to setting up setpoints and triggers for the fault and power quality recorders. 2.
Chapter 3 Using the RDM Configuring the PM180 The following table lists available port options, their default settings and ranges. Label Option Range Default Prot Communications protocol rtu rS Port interface rtu - MODBUS RTU ASCII - MODBUS ASCII dnP3 - DNP3.0 232, 422, 485 Addr Device address bAud dAtA Baud rate Data format 1-247 (MODBUS) 1-255 (DNP3.0) 300-115200 bps 7E, 8n, 8E 232 (COM1) 485 (COM2/3) 1 19200 8n To select a port option: 1. Press SELECT to activate the middle window. 2.
Chapter 3 Using the RDM Configuring the PM180 Access Control Menu Conn=on.Erdi CHG ENERGY ENTER AccS ENERGY ENTER SE P PASS 0000 0000 CtrL OFF This r.menu allows you to change the user password and enable or disable the device security. To enter the menu, select “AccS’ from the menu list. ECT To select a menu option, use the Up/Down arrow keys to scroll to the desired option. To change the password: 1. Select “PASS” in the upper window using the Up/Down arrow keys. 2.
Chapter 4 Using HyperTerminal Connecting to the Device Chapter 4 Using HyperTerminal Windows HyperTerminal allows you to configure the network, communications and security settings in your PM180, and to view certain diagnostics information such as device diagnostics and network statistics. HyperTerminal is also used for servicing the PM180 and upgrading the device firmware. Connecting to the Device Running HyperTerminal 40 1.
Chapter 4 Using HyperTerminal 6. Connecting to the Device From the File menu, select Save to save your settings for the PM180. When you next open a session and the New Connection dialog appears, click Cancel, select Open from the File menu, and then double-click on your session file. Opening a Terminal Session Put the PROGRAM-RUN key on the PM180 to the PROGRAM position. The PM180 Terminal program is launched and prints a list of the available commands as follows: PM180 Substation Automation Unit Ver.
Chapter 4 Using HyperTerminal HyperTerminal Commands > If your login was successful, you are not prompted for the password again until you close the terminal session. The default PM180 password is 0 unless you changed it through HyperTerminal or the RDM. A password is always required for a terminal session regardless of whether the communications security is enabled or disabled. After receiving the Terminal prompt “>”, you can enter your commands.
Chapter 4 Using HyperTerminal HyperTerminal Commands COM1: Protocol [MODBUS_RTU/MODBUS_ASCII/DNP3]: MODBUS_RTU New: Interface [232/422/485]: 232 New: Device Address [1-247]: 1 New: Baud Rate [300-115200]: 19200 New: Data/Parity [7E, 8N, 8E]: 8N New: CTS Protocol [y/n]: N New: RTS Protocol [y/n]: N New: Transmission Delay [0-1000 ms]: 5 New: Inter-character Timeout [1-1000 ms]: 4 New: If you want to change a protocol, device address or another port setting, type your new setting after the “New:” prompt an
Chapter 4 Using HyperTerminal HyperTerminal Commands Configuring the Network To view or change the TCP/IP network settings, type ip and press Enter. >ip Network setup: Device IP address: 192.168.0.203 New: Network subnet mask: 255.255.255.0 New: Default gateway: 192.168.0.1 New: Use DHCP [y/n]: N New: TCP port [502/20000]: 502 New: If you want to change a network setting, type your new setting after the “New:” prompt and press Enter. To leave the setting unchanged, just press Enter.
Chapter 4 Using HyperTerminal HyperTerminal Commands Testing the GPS Master Clock If you use a satellite GPS master clock for time synchronization, you can check presence and time quality of the acquired IRIG-B signal. Type irig and press Enter. >irig Testing IRIG-B time code signal. To stop test, press any key. IRIG-B: received: 24, time quality: 9, edge faults: 0, pulse faults: 2. If the IRIG-B signal is present on the PM180 IRIG-B connector, the number of received frames is updated each second.
Chapter 5 Using Telnet Connecting to the Device Chapter 5 Using Telnet Unlike using HyperTerminal through an RS-232 port, Telnet allows you to access the device through a local network or from any location in the Internet where your device is visible. Just as Windows HyperTerminal, Windows Telnet allows you to configure the network, communications and security settings in your PM180, and to view certain diagnostics information such as device diagnostics and network statistics.
Chapter 5 Using Telnet Connecting to the Device Running the Telnet Client on Windows 2000 and Windows XP 1. From the Start menu, select Run, type telnet and click OK. The following text appears in a window: Microsoft (R) Windows 2000 (TM) Version 5.00 (Build 2195) Welcome to Microsoft Telnet Client Telnet Client Build 5.00.99206.1 Escape Character is 'CTRL+]' Microsoft Telnet> 2. Type open followed by the device IP address, for example: Microsoft Telnet>open 192.168.0.
Chapter 5 Using Telnet Telnet Commands log stat diag clrdiag reset - Print Print Print Clear Reset network log network statistics device diagnostics device diagnostics the device You are prompted for the password to login, as in the following example: Login password: * > If your login was successful, you are not prompted for the password again until you close your telnet session. The default PM180 password is 0 unless you change it through HyperTerminal, Telnet or the RDM.
Chapter 6 Using PAS Installing PAS Chapter 6 Using PAS You need the support PAS software to configure most of the PM180 features, such as digital and analog I/O, recorders, energy and TOU registers. This chapter gives basic information on how to install and run PAS on your computer, and how to program your device using PAS. See Chapter 7 “Programming the PM180” for instructions on how to program particular features in your PM180.
Chapter 6 Using PAS Installing the USB Driver PM180 Substation Automation Unit 3. Click "Finish" to complete installation. Windows 2000 and Windows 98 Installation 1. On Windows 2000, the "Found New Hardware Wizard" dialog box is displayed as shown below. On Windows 98, the similar "Add New Hardware Wizard" dialog box is displayed. 2. Click "Next" to continue.
Chapter 6 Using PAS Installing the USB Driver PM180 3. Select “Search for a suitable driver for my device” (“Search for the best driver for your device” under Windows 98) and click “Next”. PM180 4. Check the "Specify a location” box. On Windows 2000, click “Next”; on Windows 98, directly move to step 5. 5. Insert the PAS Installation CD into the CD ROM Drive and click “Browse”.
Chapter 6 Using PAS Installing the USB Driver PM180 PM180 .INF 6. On Windows 2000, select the CD ROM Drive from the “Look in” box, enter the “USB” directory located under the PAS installation directory, and then click “Open”. Click “OK” to continue. On Windows 98, select the CD ROM Drive, point to the “USB” directory located under the PAS installation directory, and then click “OK”. PM180 Substation Automation Unit g:\pas\usb\pm180.inf 7. Click "Next" to continue.
Chapter 6 Using PAS Creating a New Site for your Device The next time you power up the PM180 or connect it to your PC with the USB cable, Windows automatically launches the driver for your device. Creating a New Site for your Device PAS keeps all communication and configuration data for your device in a database called a site database. When configuring your device, store all setups to the site database so that PAS recognizes device properties regardless of whether the device is online or offline.
Chapter 6 Using PAS Setting up Communications onboard logging memory. Set the current over-range to “×400%” if your device has 20A (ANSI) standard current inputs, or to “×200%” for 10A (IEC) current inputs. 5. You can add any comments into the “Comments” box, such as device location or any other data concerning this particular site. Setting up Communications You can communicate with your devices via a PC RS-232 serial port, through a modem, the Internet, or the USB port.
Chapter 6 Using PAS Setting up Communications added to the message transfer time, however, increasing it excessively slows down communications. The “Retries” box defines the number of attempts that PAS uses to receive a response from the device in the event the communication fails before announcing a communication failure. Configuring a Serial Port 1. On the Connection tab, select a COM port from the “Device” box, and then click Configure. 2. Specify the baud rate and data format for the port.
Chapter 6 Using PAS Setting Up the Device 4. You can also adjust the amount of time that PAS waits for a connection before announcing an error and the number of retries PAS uses to receive a response from the device if communications fail. Communicating through a USB On the Instrument Setup tab, click USB Port, and then click OK. Setting Up the Device Creating Setups for the Device PAS allows you to prepare setup data for your device off-line without the need to have it connected to your PC.
Chapter 6 Using PAS Setting Up the Device To download all setups to your device at once, check the On-line button on the PAS toolbar, select the device site from the list box, and then select Download Setups from the Meter Setup menu. Uploading Setup from the Device To upload the setup from the device to the site database, check the On-line button on the PAS toolbar, select the device site from the list box, and then select Upload Setups from the Meter Setup menu.
Chapter 7 Programming the PM180 Changing Port Settings Chapter 7 Programming the PM180 This chapter describes how to configure the PM180 for your particular environment and application using PAS. To access your device configuration options, you should create a site database for your device as shown in Chapter 6.
Chapter 7 Programming the PM180 Changing Port Settings Setting Up the Local Network To enter the setup dialog, select the device site from the list box on the PAS toolbar, select Communications Setup from the Meter Setup menu, and then click on the Network Setup tab. To change the Ethernet settings in your device, select desired parameters, and then click Send. For more information, see Configuring the Network in Chapter 4.
Chapter 7 Programming the PM180 Changing Port Settings The following table lists available options. Refer to your eXpertPower service provider for the correct eXpertPower settings. Parameter Options Default Description XPW Server Port 0-65535 207.232.60.
Chapter 7 Programming the PM180 Basic Device Setup Basic Device Setup Before operating your device, define the basic information about your electrical network. To enter the setup dialog, select the device site from the list box on the PAS toolbar, and then select General Setup from the Meter Setup menu. The following table lists available device configuration options. Option Basic Configuration Range Default Description Wiring connection mode (configuration) See “Wiring Connections” below 1.
Chapter 7 Programming the PM180 Device Options Option Range Power demand sync source Meter clock, Meter clock DI1-DI48 (digital inputs 1-48) Default Volt demand period, s 0 - 9000 sec 900 Amp. demand period, s 0 - 9000 sec 900 Harm. demand period 0 - 9000 sec 900 Description The source input for synchronization of the demand intervals.
Chapter 7 Programming the PM180 Option Device Options Range I4 Max. Load Current, A 0 - 10000 A Default Description CT The maximum demand load current for I4 (0 = CT primary) 0.10 Wh/pulse LED pulse constant - the amount of accumulated energy (in secondary readings) giving one pulse via “kWh” and “kvarh” LEDs. LED located in RDM and RGM, for energy measurement calibration Test Mode Energy LED pulse rate, Wh/impulse 0.01-100.
Chapter 7 Programming the PM180 Local Settings Local Settings This setup allows you to select the external time synchronization source and daylight savings time options. To configure the local time options in your device, select the device site from the list box on the PAS toolbar, select General Setup from the Meter Setup menu, and then click on the Local Settings tab.
Chapter 7 Programming the PM180 Generating Energy Pulses Option Format/Range Time synchronization input GPS IRIG-B, SNTP, GPS IRIG-B DI1-DI48 (digital input 1-48) Default Description The external port receiving the time synchronization signal. If no external synchronization is used, set this option to IRIG-B: when a signal is not present, the PM180 automatically uses internal RTC clock for time synchronization.
Chapter 7 Programming the PM180 Configuring Digital Inputs To configure the energy pulses in your device, select the device site from the list box on the PAS toolbar, select General Setup from the Meter Setup menu, and then click on the Energy Pulses tab.
Chapter 7 Programming the PM180 Configuring Digital Inputs in the order of connection when the device is powered up. For example, if two DI modules are connected to the device, the digital inputs DI1-DI16 belong to the first module, and DI17-DI32 - to the following module. If you insert an I/O module into another slot position and do not change its order, then all digital inputs on the module retain their I/O numbers.
Chapter 7 Programming the PM180 Programming Relay Outputs Option Range Default Description Fault Recorder Checked Unchecked Unchecked When the box is checked, a positive transition on the digital input (open to closed transition event) triggers the Fault recorder. Debounce Time The debounce time is assigned to digital inputs in groups of 8 adjacent inputs. So, DI8 has the same debounce time as inputs DI1 through DI7, while DI9 through DI16 are allowed to have another debounce time setting.
Chapter 7 Programming the PM180 Programming Relay Outputs The available relay options are described in the following table: Option Format/Range Default Operation Mode UNLATCHED LATCHED PULSE KYZ Polarity NORMAL (N.O.) INVERTING (N.C.) UNLATCHED Defines the behavior of the relay in response to local and remote commands Unlatched mode: the relay goes into its active state when the control setpoint is in active (operated) state, and returns into its non-active state when the setpoint is released.
Chapter 7 Programming the PM180 Programming Analog Inputs Option Format/Range Default Retentive mode CHECKED UNCHECKED Pulse width 10-1000 ms Pulse source None kWh IMP PULSE kWh EXP PULSE kWh TOT PULSE kvarh IMP PULSE kvarh EXP PULSE kvarh TOT PULSE kVAh TOT PULSE DMD INTRVL SW DMD INTRVL AMP DMD INTRVL TARIFF INTRVL 0.1-1000.0 1.0 UNCHECKED This option is only applicable for latched relays.
Chapter 7 Programming the PM180 Programming Analog Inputs The available AI options are listed in the following table: Option Range Description AI type The AI module type. When connected to the device, shows the actual AI type read from the AI module. Zero scale 0-1 mA ±1 mA 0-20 mA 4-20 mA 0-50 mA ±10 V 0/4 mA Full scale 1/20/50 mA, 10V Dec.
Chapter 7 Programming the PM180 Programming Analog Outputs Scaling ±1mA Analog Inputs When programming engineering scales for directional ±1mA analog inputs, you should provide only the engineering scale for the +1 mA input current. The engineering scale for the 0 mA input current is always equal to zero. The device does not allow you to access this setting.
Chapter 7 Programming the PM180 Programming Analog Outputs When you select an output parameter for the analog output channel, the default engineering scales are set automatically. They represent the maximum available scales for the parameter. If the parameter actually covers a lower range, you can change the scales to provide a better resolution on the analog output.
Chapter 7 Programming the PM180 Using Counters Scaling Analog Outputs for 0-2 mA and ±2 mA The output scales for 0-1 mA and ±1 mA analog outputs are programmed for 0 mA and +1 mA regardless of the desired output current range.
Chapter 7 Programming the PM180 Using Periodic Timers Using Periodic Timers The PM180 has 16 programmable timers that are used for periodic recording and triggering operations on a time basis through the Control Setpoints. When a preprogrammed timer interval is expired, the timer generates an internal event that can trigger any setpoint (see Using Control Setpoints). The programmable time interval can be from 1/2 cycle and up to 24 hours.
Chapter 7 Programming the PM180 Using Control Setpoints To program the setpoints, select General Setup from the Meter Setup menu, and then click on the Control/Alarm Setpoints tab.
Chapter 7 Programming the PM180 Using Control Setpoints Using Logical Expressions Logical operators OR/AND are treated in a simplified manner. They have no specific priority or precedence rules. Any trigger condition bound to the logical expression by the OR operator and evaluated as “true” overrides any preceding condition evaluated as “false”. Similarly, any trigger condition evaluated as “false” and bound by the AND operator overrides any condition evaluated before it as “true”.
Chapter 7 Programming the PM180 Using Control Setpoints Fault recorders, and others can be programmed to generate periodic events at userdefined intervals (see Using Periodic Timers). Interval timers are not synchronized with the clock. When you run a timer, it generates a pulsed timer event that can trigger a setpoint if you have put the timer into a list of the setpoint triggers.
Chapter 7 Programming the PM180 Using Control Setpoints Generally, setpoint actions are performed independently for each setpoint and can be repeated a number of times for the same target. The exceptions are relay operations, data logging and waveform logging that are shared between all setpoints using an OR scheme for each separate target.
Chapter 8 Configuring Recorders Configuring Device Memory Chapter 8 Configuring Recorders The PM180 is provided with a 256MB onboard non-volatile memory for data, event and waveform recording. Before using recorders, the device memory must be partitioned between log files. The device memory is fully configurable; you can define how much memory to allocate for each log file. If you want to change the factory settings, follow the guidelines in the section below.
Chapter 8 Configuring Recorders Option Configuring Device Memory Format/Range Description Shows the size of the file record for a single channel or section. It is set automatically depending on the file and on the number of parameters in the data record Defines the number of parameters in a single data record for data log files. Record size Parameters Memory is allocated for each file statically and does not change unless you reorganize the files.
Chapter 8 Configuring Recorders Configuring the Event Recorder No. File Type Size, Bytes Sections/ Channel Max. of Records Max.
Chapter 8 Configuring Recorders Configuring the Sequence-of-Events Recorder conditions that caused the event and all setpoint actions performed in response to the event. Configuring the Sequence-of-Events Recorder The Sequence-of-Events (SOE) recorder can log four types of events: Digital input events Relay output events Fault events Setpoint events Each state transition on a source point (open/closed, start/end) is recorded as a separate event. Fault events are recorded to the file by default.
Chapter 8 Configuring Recorders 1. 2. 3. 4. 5. Configuring the Data Recorder Select Labels from the Meter Setup menu, and then click on the appropriate tab. Type in the labels and descriptions you want to give the event source points and their status. Select appropriate label colors. Click on “Save as” to save your settings to the site database.
Chapter 8 Configuring Recorders 7. Configuring the Data Recorder Highlight the data log file row with the left mouse button, and then click on the “Setup Recorder” button, or click on the “Data Recorder” tab and select the log number corresponding to your file. 8. Configure the list of parameters to be recorded in the data log file. You are not allowed to select more parameters than you defined when configuring your file. Refer to Appendix C for a list of available parameters.
Chapter 8 Configuring Recorders Configuring the Data Recorder No Parameter . No.
Chapter 8 Configuring Recorders Configuring the Waveform Recorder In order to correctly allocate the memory space for TOU profile log files, assign TOU registers before you set up your TOU profile log files. To configure a TOU daily profile log file: 1. Configure your TOU registers and TOU schedule before allocating memory for a profile log file (see Configuring Summary and TOU Registers in Chapter 9). 2. Select Memory/Log from the Meter Setup menu, and then click on the Log Memory tab. 3.
Chapter 8 Configuring Recorders Configuring the Waveform Recorder The total number of records you must allocate to store the required number of events (series) is defined as follows: Number of Records = Number of Records per Series x Number of Series For example, if you want to record a 64-cycle waveform sampled at a rate of 32 samples per cycle, the number of records required for one waveform series would be: Number of Records per Series = (32 x 64)/512 = 4.
Chapter 8 Configuring Recorders Configuring the IEEE 1159 Power Quality Recorder 10. To select the channels, click on the “Channels” button, check the boxes for channels to be recorded, and then click OK. Note that the standard (20A) and extended (100A) current channels may not be recorded together in the same file. 11. Save your waveform setup to the site database, and send it to the device. The picture above shows the factory preset waveform logs.
Chapter 8 Configuring Recorders Configuring the IEEE 1159 Power Quality Recorder used to detect voltage and frequency faults, their typical triggering thresholds and event durations. Impulsive transients Impulsive transients are detected as impulses with a rise time less than 0.5 ms and duration from 150 us to ½ cycle. The impulse magnitude is measured as the overshoot voltage magnitude above the normal voltage wave shape. It is referenced to the nominal peak voltage (1.414 Un).
Chapter 8 Configuring Recorders Configuring the IEEE 1159 Power Quality Recorder PM180_USB – Log Setup The available PQ recorder options are shown in the following table: Option Range Thresholds Threshold, % Default 0-200.0% Hysteresis, % 0-50.0% 5.0 Description Defines the operating threshold for the PQ trigger in percent of the nominal (reference) value Defines the hysteresis for PQ trigger in percent of the threshold Waveform Log On Start On End Log No.
Chapter 8 Configuring Recorders Configuring the EN50160 Power Quality Recorder (aggregation intervals) for data tracing and changes the recording rate accordingly. You can specify for each PQ trigger how much time to record data using one or more time envelopes. To enable or disable the PQ recorder: 1. 2. Check or uncheck the “Recorder Enabled” checkbox. Send your setting to the device.
Chapter 8 Configuring Recorders Configuring the EN50160 Power Quality Recorder Voltage characteristic Compliance with stated limits, % of time Observation period Power frequency 1% for 95% of a week 1% for 99.
Chapter 8 Configuring Recorders Configuring the EN50160 Power Quality Recorder Evaluation Techniques EN50160 Evaluation Counters Evaluation Counters and Evaluation Period The PM180 uses a set of the evaluation counters for collecting EN50160 statistics within a specified evaluation period. The evaluation period is the period of time within which the device collects statistical evaluation data. Supply voltage characteristics can be evaluated on a weekly or daily basis.
Chapter 8 Configuring Recorders Configuring the EN50160 Power Quality Recorder troubleshooting problems throughout the electrical network, for example, to identify and locate the source of a power quality event and to select an appropriate solution. The EN50160 power quality report can be uploaded and viewed via PAS (see Viewing EN50160 Power Quality Event Log).
Chapter 8 Configuring Recorders Configuring the EN50160 Power Quality Recorder Target Values The maximum rate of rapid voltage changes in normally once per hour or less. For voltage variations repeating more than once an hour, amplitude is limited by the flicker index. The maximum rate of rapid voltage changes in variations per hour can be changed in the device via the EN50160 Advanced Setup.
Chapter 8 Configuring Recorders Configuring the EN50160 Power Quality Recorder Voltage Interruptions Voltage interruptions correspond to temporary loss of supply voltage on all phases lasting less than or equal to 3 minutes in the event of short interruptions, and more than 3 minutes for long interruptions. Method of Evaluation The voltage interruption is detected when the voltages on all phases fall below the interruption threshold (as per IEC 61000-4-30) specified by the EN50160 at a level of 1% Un.
Chapter 8 Configuring Recorders Configuring the EN50160 Power Quality Recorder the peak voltage value and is referenced to the nominal peak voltage (1.414 Un). The device can detect transient overvoltages with a magnitude of up to 700V. Statistical Survey The PM180 provides the statistical evaluation of transient overvoltages using the classification recommended by Eurelectric’s Measurement guide for voltage characteristics.
Chapter 8 Configuring Recorders Configuring the EN50160 Power Quality Recorder Interharmonic Voltage Method of Evaluation Since the EN50160 does not specify target limits for interharmonic voltages, this feature is normally disabled. You can enable evaluation of interharmonic voltages via the EN50160 Advanced Setup.
Chapter 8 Configuring Recorders Configuring the EN50160 Power Quality Recorder Configuring the EN50160 Recorders Basic Device Settings The following device settings affect the EN50160 evaluation and should be checked prior to running the EN50160 recorders.
Chapter 8 Configuring Recorders Configuring the EN50160 Power Quality Recorder 4. Select the waveform logging options for PQ events. 5. Download your setup to the device. The picture above shows the default PQ recorder settings. The available options are listed in the following table. Option PQ Log Range Threshold, % 0-200.
Chapter 8 Configuring Recorders Configuring the EN50160 Power Quality Recorder The power quality fault signal is used for cross triggering multiple recorders through a dedicated digital input in order to simultaneously record disturbances at different locations. External triggering of the Waveform and Data recorders for recording disturbance data is done through a setpoint programmed to monitor the status of a digital input.
Chapter 8 Configuring Recorders Configuring the EN50160 Power Quality Recorder The available options are listed in the following table.
Chapter 8 Configuring Recorders Configuring the Fault Recorder Option Range Default Description 2nd Signaling Frequency 3rd Signaling Frequency 4th Signaling Frequency 110-3000 Hz 191.0 Hz 110-3000 Hz 217.0 Hz 110-3000 Hz 317.
Chapter 8 Configuring Recorders Option Thresholds Range Threshold, % 0-200.0% Threshold, secondary Hysteresis, % 0-50.0% Trigger Enabled Checked Unchecked Configuring the Fault Recorder Default Description 5.0 Defines the operating threshold for the fault trigger in percent of the nominal (reference) value Shows the setup value in secondary units for the selected operating threshold Defines the hysteresis for fault trigger in percent of the threshold Links the fault trigger to the Fault Recorder.
Chapter 8 Configuring Recorders Configuring the Fault Recorder them, adjust the thresholds according to your network conditions before enabling triggers. The Current Unbalance trigger has a different calculation algorithm than the common current unbalance measurements. Since the unbalance readings give a relation of the maximum deviation from the average to the phase average current, the value could produce high readings for low currents and may not be used as a fault trigger.
hapter 9 Totalization Energy and C TOU Registers Configuring Summary and TOU Registers Chapter 9 Totalization Energy and TOU Registers The PM180 provides 16 summary energy registers and 16 parallel TOU energy and maximum demand registers to link to any internal energy source or to any external pulse source that delivers energy pulses through the device digital inputs. A total of 64 energy sources can be connected to the summary and TOU registers.
hapter 9 Totalization Energy and TOU C Registers Configuring TOU Daily Profiles Option Format/Range Default Summary Energy/TOU Registers Description TOU Enabled Unchecked Links the summary energy register to the parallel TOU energy register None None - no effect. SP1-SP32 - connects the energy source to the summary register only when setpoint conditions are fulfilled. None Links an energy source to the register 1 The multiplication factor for the energy source.
hapter 9 Totalization Energy and C TOU Registers Configuring TOU Calendars Configuring TOU Calendars To configure the TOU daily profiles, select Energy/TOU from the Meter Setup menu, and then click on the TOU Daily Profiles tab. To configure your calendars: 1. 2. 3. 4. 5. Select the calendar year for your calendar and set the month to January. In the “Current Profile No.” box, select the first daily profile number that is active in this month. Click on day cells when this profile will be active.
hapter 10 Configuring Communication C Protocols Configuring MODBUS Chapter 10 Configuring Communication Protocols This section describes how to customize protocol options for use with your application software. Configuring MODBUS MODBUS Point Mapping The PM180 provides 120 user assignable registers in the address range of 0 to 119.
hapter C 10 Configuring Communication Protocols 1. 2. 3. Configuring DNP3 From the Meter Setup menu select Protocol Setup and click on the Modbus Registers tab. Change the raw scales in the Modbus Options pane. The allowable range is 0 to 65535. Click Send to download your setup to the device. Configuring DNP3 DNP Options can be changed both via DNP3 and Modbus. Refer to the PM180 DNP3 Reference guide for information on the protocol implementation and a list of the available data points.
hapter 10 Configuring Communication C Protocols Configuring DNP3 Parameter Options Default Description Analog Input Object 32-bit 32-bit –Flag 16-bit 16-bit –Flag 32-bit -Time 32-bit +Time 16-bit -Time 16-bit +Time 16-bit -Flag The default AI object variation for requests with qualifier code 06 when no specific variation is requested 16-bit +Time The default AI change event object variation for requests with qualifier code 06 when no specific variation is requested 0-64 3 0 The total number
hapter C 10 Configuring Communication Protocols Configuring DNP3 Scaling is enabled by default. It is not applied to points that are read using 32-bit AI objects. Refer to the PM180 DNP3 Reference Guide for information on the data point scales and on a reverse conversion that should be applied to the received scaled values. Scaling 16-bit Binary Counters Scaling 16-bit Binary Counters allows changing a counter unit in powers of 10 to accommodate a 32-bit counter value to 16-bit BC object format.
hapter 10 Configuring Communication C Protocols Configuring DNP3 Object change events are normally polled via DNP Class 1, Class 2 or Class 3 requests. You can link any change event point to any event class upon the event priority. Refer to the PM180 DNP3 Reference Guide for more information on polling event classes via DNP. A change event point index is normally the same as for the corresponding static object point.
hapter C 10 Configuring Communication Protocols 5. 6. 7. Configuring DNP3 In the “Ev Class” box, select the event poll class for the change event points. Repeat these steps for all points you want to be monitored for events. Click Send to download your setup to the device.
Chapter 11 Device Control Remote Relay Control Chapter 11 Device Control This chapter describes how to change device modes, view and clear device diagnostics, and directly operate relay outputs in your PM180 from PAS. To access device control options you should have your device online.
Chapter 11 Device Control Device Event Flags Device Event Flags The PM180 has 16 common event flags that are intended for use as temporary event storage and can be tested and operated from the control setpoints. You can transfer an event to the setpoint and trigger its operation remotely by changing the event status through PAS. To enter the Event Flags dialog, check the On-line button on the PAS toolbar, select Device Control from the Monitor menu, and then click on the Event Flags tab.
Chapter 11 Device Control Updating the Clock To clear the device diagnostics events, click on Clear. Refer to Device Diagnostic Codes in Appendix F for the list of diagnostic codes and their meanings. See Device Diagnostics in Chapter 2 for more information about device diagnostics. Updating the Clock To update the Real-Time Clock (RTC) in your device, select a device site from the list box on the toolbar, check the On-line button on the PAS toolbar, and then select RTC from the Monitor menu.
Chapter 11 Device Control Resetting Accumulators and Clearing Log Files To reset the desired accumulation registers or to clear a file, click on the corresponding button. If a target has more than one component, you are allowed to select components to reset. Check the corresponding boxes, and then click OK.
Chapter 12 Monitoring Devices Viewing Real-time Data Chapter 12 Monitoring Devices Viewing Real-time Data Real-time data is continuously retrieved from your devices and updated on the screen at the rate you defined in the Instrument Setup. To get real-time data from your device, select the device site from the list box on the PAS toolbar, point to RT Data Monitor on the Monitor menu, and then select a data set you want to view.
Chapter 12 Monitoring Devices Viewing Real-time Data Polling Options To change the polling options, click on the Data Monitor window with the right mouse button and select Options. If you check “Do not stop on errors”, polling is resumed automatically when a communication error occurs, otherwise polling stops until you restart it manually. Viewing a Data Table Changing the Data View PAS displays data in either a single record or multi-record view.
Chapter 12 Monitoring Devices Viewing Real-time Data Selecting Primary and Secondary Units Voltages and currents can be displayed in primary or secondary units. To select primary or secondary units for your data views, click on the monitor window with the right mouse button, select Options, select the desired units for voltages and currents, and then click OK. Viewing Data Trend To view a data trend, click on the button on the local toolbar.
Chapter 12 Monitoring Devices Viewing Real-time Data Delta Measurements To measure the distance between two trend points, click on the Delta button on the toolbar, click with the left mouse button on the first point, and then click on the second point. The first reference point is frozen until you close and reopen Delta, while the second point can be placed anywhere within the trend line. You can measure a delta in both directions. To disable Delta, click on the Delta button again.
Chapter 12 Monitoring Devices Viewing Real-time Min/Max Log 5. Adjust the file update rate for automatic recording. It must be a multiple of the sampling rate that you defined in the Instrument Setup dialog. 6. Click Save. When you run real-time data polling, PAS automatically saves retrieved records to the database at the rate you specified. The “RT Logging On/Off” button on the toolbar should be checked all the time to allow PAS to perform logging.
hapter 13 Retrieving Recorded C Files Viewing Real-time Waveforms Chapter 13 Retrieving Recorded Files Using PAS, you can retrieve recorded events, data and waveforms from your devices and save them to files on your PC in the MS Access database format. Historical data can be uploaded on demand any time you need it, or periodically through the Upload Scheduler that retrieves data automatically on a predefined schedule, for example, daily, weekly or monthly.
Chapter 13 Retrieving Recorded Files Viewing Real-time Waveforms Using the Upload Scheduler To setup the Upload Scheduler: 1. Select Upload Scheduler from the Logs menu. 2. 3. 4. Click Add Site, point to the site database for which you want to organize the schedule, and then click OK. Click Browse and select a database for storing retrieved data, or type the name for a new database, select a directory where you want to save it, and then click OK. Click Configure or double click on the site row. 5.
hapter 13 Retrieving Recorded C Files Viewing Real-time Waveforms does not cause loss of data, since the scheduler will resume operations when you check this button again. Suspending the Scheduler To suspend the Upload Scheduler, check the Suspend Scheduler box at right. To activate the Upload Scheduler, leave this box unchecked. Running the Scheduler on Demand You can run the scheduler at any time outside the schedule by checking the Start Now box at right. This is a one-time action.
Chapter 13 Retrieving Recorded Files Viewing Real-time Waveforms See Chapter 14, Viewing Log Files, for information on using different log views.
Chapter 14 Viewing Log Files General Operations Chapter 14 Viewing Log Files General Operations Opening a Log File To open a log file, click on the Open button on the PAS toolbar, or select “Open...” from the File menu. In the “Files of type” box, select “Access Database (*.mdb)”, select a directory where your files are located, point to the file you want to open, select a desired table on the right pane, and then click Open.
Chapter 14 Viewing Log Files Viewing the Event Log units. To change the disturbance units, select Options from the Tools menu, click on the Preferences tab, select the preferred units, and then click OK. Viewing the Event Log Event log files are displayed in a tabular view, one event per row. PAS loads the entire database table to a window, so that you can scroll through the entire log to view its contents.
Chapter 14 Viewing Log Files Viewing the Sequence-of-Events Log The event ID for which PAS finds related data is blue colored. Click on the colored event ID to check a list of the event links. Click on a list item to move to the related waveform or data log record. Viewing the Sequence-of-Events Log SOE log files are displayed in a tabular view, one event per row.
Chapter 14 Viewing Log Files Viewing the Power Quality Event Log To change the event sorting order, click on the Sort button , or click on the report window with the right mouse button and select “Sort...”, check the desired sort order, and then click OK. Linking to Waveforms, Fault Log and Data Records Event points, for which PAS finds related data in other database records, are blue colored. Click on the colored event point with the left mouse button to check a list of the event links.
Chapter 14 Viewing Log Files Viewing the Power Quality Event Log Linking to Waveforms and Data Records PQ events for which PAS finds related links are blue colored. Click on the colored event ID to check a list of the event links. Click on a list item to move to the related waveform or data log records. Data log records associated with the event are taken into a separate window for easy viewing and trending.
Chapter 14 Viewing Log Files Viewing the IEEE 1159 Statistics Report Viewing the IEEE 1159 Statistics Report PAS can generate IEEE 1159 statistics reports on the collected power quality event data. To get an IEEE 1159 statistics report, select “IEEE 1159 Statistics” from the Reports menu, point to the database where you stored the retrieved power quality log data, and then click Open. The IEEE 1159 statistics is reported within the selected time range on either a weekly, or yearly basis.
Chapter 14 Viewing Log Files Viewing the IEEE 1159 Statistics Report Changing the Report Time Range and Contents Click on the report with the right mouse button, select “Options…”, select the required time range, check the voltage characteristics to be included in the report, and then click OK.
Chapter 14 Viewing Log Files Viewing EN50160 Statistics Reports Customizing Reports If you wish to add a logo image, header and footer to your reports: 1. Select “Report Setup…” from the Reports menu, or click on the report window with the right mouse button, and then select “Report Setup…”. 2. 3. 4. 5. Click on the Change button and select a logo image file. Check the “Show” box to include your logo into a report. Type the header text in the Page Header box.
Chapter 14 Viewing Log Files Viewing EN50160 Statistics Reports The standard compliance statistics is reported within the selected time range on a daily, weekly or yearly basis depending on the observation periods stated in the EN50160 for voltage characteristics. If the time range includes a number of the observation intervals, each interval’s statistics is given in a separate row. For power frequency, both weekly and yearly compliance statistics are provided.
Chapter 14 Viewing Log Files Viewing the Fault Log Customizing Reports For information on how to add a logo image, the header and the footer to your reports, see Customizing Reports in the previous section. Viewing the EN50160 Online Statistics Report If you retrieved the EN50160 online statistics data, you can view the online report on the last retrieved statistics in the same manner as the EN50160 Compliance statistics report.
Chapter 14 Viewing Log Files Viewing the Data Log To change the sorting order, click on the Sort button , or click on the report window with the right mouse button and select “Sort...”, check a desired sort order, and then click OK. Selecting Primary and Secondary Units Voltages and currents can be displayed in primary or secondary units.
Chapter 14 Viewing Log Files Viewing the Data Log Viewing Data Trend To view data in a graphical form, click on the Data Trend toolbar. button on the local To change the time range for your graph, click on the Time Range button local toolbar, and then select the desired date and time range. on the Selecting Channels To select desired data channels for your trend, click on the trend window with the right mouse button, select “Channels”, check the channels you want displayed, and then click OK.
Chapter 14 Viewing Log Files Viewing Waveforms Using the Marker Lines The trend window has two blue dashed marker lines. The left marker indicates the starting position and the right marker indicates the end position for calculating the average and peak values. To change the marker position, click on the trend window with the right mouse button, select Set Marker, or click on the button on the window toolbar, and then click with left mouse button on the point where you want to put the marker.
Chapter 14 Viewing Log Files Viewing Waveforms You can open all five views together to analyze different properties of the waveform like a wave shape, waveform disturbance, unbalance, or spectrum. When you move to another waveform record, all views are updated simultaneously to reflect the changes. To view overlapped waveforms, click on the button on the local toolbar; to view non-overlapped waveforms, click on the button.
Chapter 14 Viewing Log Files Viewing Waveforms Viewing an RMS Plot PAS can show you a cycle-by-cycle RMS plot of the sampled AC waveforms. To open the RMS view, click on the button. The graph shows the RMS points updated each half cycle. Viewing a Frequency Plot To view a cycle-by-cycle frequency plot of the sampled voltage waveforms, click on the button. Viewing a Spectrum Chart Click on the button to view a spectrum chart for the selected waveform channel.
Chapter 14 Viewing Log Files Viewing Waveforms The order of the highest displayed harmonic component is equal to the half sampling rate at which the waveforms are sampled minus one. If the waveform was sampled at a rate of 128 samples per cycle, 63 harmonics are available. With 32 samples per cycle, only 15 harmonics are calculated, while others will be zeros.
Chapter 14 Viewing Log Files Viewing Waveforms Viewing a Spectrum Table Click on the button on the local toolbar to display the harmonics spectrum in a tabular view for a selected phase or for all phases together. The spectrum table shows voltage, current, active power and reactive power harmonic components both in percent of the fundamental and in natural units, and harmonic phase angles. To change a phase, click on the window with the right mouse button, select “Options...
Chapter 14 Viewing Log Files Viewing Waveforms Waveform Options Scrolling through Waveforms The status bar at the bottom of the window shows you how many records the log file contains. Use green arrowheads on the window toolbar to scroll through records. Selecting Waveform Channels A single waveform record may contain up to 56 waveforms including AC, VDC, digital and analog input channels, which can be displayed all together in a non-overlapped waveform view.
Chapter 14 Viewing Log Files Viewing Waveforms Viewing Phasor Diagrams The phasor diagrams show you the relative magnitudes and angles of the threephase voltage and current fundamental component. All angles are shown relative to the reference voltage channel. PAS V1.4 - [C:\Pas] Waveform Log 7 PM180_USB PM180_USB PM180_USB To change the reference channel, click on the waveform window with the right mouse button, select “Options...
Chapter 14 Viewing Log Files Viewing Waveforms If you leave the Triangle box checked, PAS connects the ends of the voltage and current vectors showing you three-phase voltage and current triangles. This is useful when analyzing voltage and current unbalances. Phasor diagrams are calculated over one waveform cycle pointed to by the left marker line. As you move the marker, the phasor diagrams are updated reflecting the new marker position.
Chapter 14 Viewing Log Files Viewing Synchronized Waveforms mouse button, then point to another corner of the selected region and release the mouse button. Delta Measurements To measure the distance between two waveform points, click on the Delta button , then click on one point, and then click on the second point. The first reference point is still frozen until you close and reopen Delta, while the second point can be placed anywhere within the waveform line. You can measure a delta in both directions.
Chapter 14 Viewing Log Files 4. 5. Viewing Synchronized Waveforms Click on the “Channels” button and select channels for each site. Click OK. To change the channels, click on the waveform window with the right mouse button and select “Channels...”.
Chapter 15 COMTRADE and PQDIF Converters Manual Converting Chapter 15 COMTRADE and PQDIF Converters The COMTRADE and PQDIF file converters allow you to convert waveforms into COMTRADE or PQDIF file format, and data log tables – into PQDIF format. Manual Converting To manually convert your waveforms or a data log into COMTRADE or PQDIF format: 1. Click on the Export toolbar. button on the PAS 2. Select the database and a waveform or data log table you want to export, and then click Open. 3.
Chapter 15 COMTRADE and PQDIF Converters Automatic Converting Automatic Converting PAS allows you to automatically convert waveform and data logs into COMTRADE or PQDIF format at the time you upload data from your devices via the Upload Scheduler. To automatically convert your waveform or data log tables into COMTRADE or PQDIF format: 1. Open the Upload Scheduler. 2. 3. 4. 5. 6. 7. 152 Highlight a desired device site with the left mouse button, and then click on the Export button.
Appendix A Parameters for Analog Output Appendix A Parameters for Analog Output The following table lists parameters that can be provided on the device’s analog outputs.
Appendix A Parameters for Analog Output Designation PF LEAD AVR VOLT AVG AVR VOLT AVG LL AVR AMPS AVG AVR In AVR FREQ AVR kW IMP ACC DMD kW EXP ACC DMD kvar IMP ACC DMD kvar EXP ACC DMD kVA ACC DMD 154 Description Total PF Lead 3-phase average L-N voltage 3-phase average L-L voltage 3-phase average current 1-Sec Auxiliary Values In Current Frequency Present Demands Accumulated kW import demand Accumulated kW export demand Accumulated kvar import demand Accumulated kvar export demand Accumulated kVA deman
Appendix B Setpoint Actions Appendix B Setpoint Actions Action NONE SET EVENT FLAG CLEAR EVENT FLAG OPERATE RELAY RELEASE RELAY INCREMENT COUNTER DECREMENT COUNTER CLEAR COUNTER RESET ENERGY RESET DEMANDS RESET DEMANDS RESET DEMANDS RESET DEMANDS RESET DEMANDS RESET DEMANDS RESET TOU ENERGY RESET TOU DEMANDS RESET ALL COUNTERS CLEAR MIN/MAX LOG EVENT LOG EVENT LOG EVENT LOG DATA LOG WAVEFORM LOG SOE LOG EXT TRIGGER PM180 Substation Automation Unit Target Description 1-16 1-16 1-32 1-32 1-32 None (n
Appendix C Parameters for Monitoring and Data Logging Appendix C Parameters for Monitoring and Data Logging The following table lists parameters measured by the PM180 that are available for monitoring via communication ports, for data logging, and for triggering setpoints.
Appendix C Parameters for Monitoring and Data Logging Designation Description YEAR MONTH DAY OF MONTH HOURS MINUTES SECONDS SYMM COMP V PSEQ V NSEQ V ZSEQ V NSEQ UNB% V ZSEQ UNB% I PSEQ I NSEQ I ZSEQ I NSEQ UNB% I ZSEQ UNB% RMS (1/2 cycle) V1 V2 V3 V4 V12 V23 V31 I1 I2 I3 I4 In I1x I2x I3x I4x Inx V ZERO-SEQ I ZERO-SEQ Ix ZERO-SEQ V UNB% I UNB% Ix UNB% VDC RT PHASE V1 V2 V3 I1 I2 I3 kW L1 kW L2 kW L3 kvar L1 kvar L2 kvar L3 kVA L1 Year Month Day of month Hours Minutes Seconds Symmetrical Components Posi
Appendix C Parameters for Monitoring and Data Logging Designation Description kVA L2 kVA L3 PF L1 PF L2 PF L3 V1 THD kVA L2 kVA L3 Power factor L1 Power factor L2 Power factor L3 V2 THD V2/V23 Voltage THD 1 V3 THD V3/V31 Voltage THD 1 I1 Current THD I2 Current THD I3 Current THD I1 K-Factor I2 K-Factor I3 K-Factor I1 Current TDD I2 Current TDD I3 Current TDD V12 Voltage V23 Voltage V31 Voltage I1x Current I2x Current I3x Current 1-Cycle Low Values on any Phase Low L-N voltage Low current Low kW Low
Appendix C Parameters for Monitoring and Data Logging Designation Description kvar kVA PF PF LAG PF LEAD kW IMP kW EXP kvar IMP kvar EXP V AVG V LL AVG I AVG RT AUX I4 In FREQ V UNB% I UNB% VDC V4 I4x AVR PHASE V1 V2 V3 I1 I2 I3 kW L1 kW L2 kW L3 kvar L1 kvar L2 kvar L3 kVA L1 kVA L2 kVA L3 PF L1 PF L2 PF L3 V1 THD Total kvar Total kVA Total PF Total PF lag Total PF lead Total kW import Total kW export Total kvar import Total kvar export 3-phase average L-N voltage 3-phase average L-L voltage 3-phase av
Appendix C Parameters for Monitoring and Data Logging Designation Description I2x I3x AVR LOW V LOW I LOW kW LOW kvar LOW kVA LOW PF LAG LOW PF LEAD LOW THD LOW I2x Current I3x Current 1-Second Low Values on any Phase Low L-N voltage Low current Low kW Low kvar Low kVA Low lagging PF Low leading PF V THD LOW KF LOW I TDD LOW V L-L LOW V THD/I LOW I THD/I LOW AVR HIGH V HIGH I HIGH kW HIGH kvar HIGH kVA HIGH PF LAG LOW PF LEAD LOW THD LOW V THD LOW KF LOW I TDD LOW V L-L LOW V THD/I LOW I THD/I LOW AVR
Appendix C Parameters for Monitoring and Data Logging Designation Description V1 V2 V3 V4 V12 V23 V31 I1 I2 I3 I4 In I1x I2x I3x I4x Inx V ZERO-SEQ I ZERO-SEQ Ix ZERO-SEQ V UNB% I UNB% Ix UNB% VDC RMS (3 sec) V1 V2 V3 V4 V12 V23 V31 I1 I2 I3 I4 In I1x I2x I3x I4x Inx V ZERO-SEQ I ZERO-SEQ Ix ZERO-SEQ V UNB% I UNB% Ix UNB% VDC RMS (10 min) V1 V2 V3 V4 V12 V23 V1 voltage V2 voltage V3 voltage V4 voltage V12 voltage V23 voltage V31 voltage I1 current I2 current I3 current I4 current In current I1x current
Appendix C Parameters for Monitoring and Data Logging Designation Description V31 I1 I2 I3 I4 In I1x I2x I3x I4x Inx V ZERO-SEQ I ZERO-SEQ Ix ZERO-SEQ V UNB% I UNB% Ix UNB% VDC RMS (2 hour) V1 V2 V3 V4 V12 V23 V31 I1 I2 I3 I4 In I1x I2x I3x I4x Inx V ZERO-SEQ I ZERO-SEQ Ix ZERO-SEQ V UNB% I UNB% Ix UNB% VDC HRM TOT (0.
Appendix C Parameters for Monitoring and Data Logging Designation Description I1 THD/I I2 THD/I I3 THD/I I4 THD/I I1 TDD I2 TDD I3 TDD I4 TDD I1 KF I2 KF I3 KF I4 KF V1 CF I1 interharmonics THD I2 interharmonics THD I3 interharmonics THD I4 interharmonics THD I1 TDD I2 TDD I3 TDD I4 TDD I1 K-Factor I2 K-Factor I3 K-Factor I4 K-Factor V2 CF V2/V23 Crest Factor 1 V3 CF V3/V31 Crest Factor 1 V4 Crest Factor I1 Crest Factor I2 Crest Factor I3 Crest Factor I4 Crest Factor 3-Second Total Harmonics V4 CF
Appendix C Parameters for Monitoring and Data Logging 164 Designation Description V1 THD V1/V12 THD 1 V2 THD V2/V23 THD 1 V3 THD V3/V31 THD 1 V4 THD V4 THD I1 THD I1 THD I2 THD I2 THD I3 THD I3 THD I4 THD I4 THD V1 THD/I V1/V12 interharmonics THD 1 V2 THD/I V2/V23 interharmonics THD 1 V3 THD/I V3/V31 interharmonics THD 1 V4 THD/I V4 interharmonics THD I1 THD/I I1 interharmonics THD I2 THD/I I2 interharmonics THD I3 THD/I I3 interharmonics THD I4 THD/I I4 interharmonics TH
Appendix C Parameters for Monitoring and Data Logging Designation Description I4 TDD I4 TDD I1 KF I1 K-Factor I2 KF I2 K-Factor I3 KF I3 K-Factor I4 KF I4 K-Factor V1 CF V1/V12 Crest Factor1 V2 CF V2/V23 Crest Factor1 V3 CF V3/V31 Crest Factor1 V4 CF V4 Crest Factor I1 CF I1 Crest Factor I2 CF I2 Crest Factor I3 CF I3 Crest Factor I4 CF I4 Crest Factor PHASORS Phasors V1 Mag V1/V12 Voltage magnitude 1 V2 Mag V2/V23 Voltage magnitude 1 V3 Mag V3/V31 Voltage magnitude 1 V4
Appendix C Parameters for Monitoring and Data Logging 166 Designation Description kVA ACC DMD kVA accumulated demand kW IMP PRD DMD kW import predicted sliding window demand kvar IMP PRD DMD kvar import predicted sliding window demand kVA PRD DMD kVA predicted sliding window demand PF IMP@kVA MXDMD PF (import) at Maximum kVA sliding window demand kW EXP BD kW export block demand kvar EXP BD kvar export block demand kW EXP SD kW export sliding window demand kvar EXP SD kvar export slidi
Appendix C Parameters for Monitoring and Data Logging Designation Description Vh Volt-hours Ah Ampere-hours SUMMARY REGS Summary (TOU Total) Energy Registers SUM REG1 Summary energy register #1 SUM REG2 Summary energy register #2 … … SUM REG16 Summary energy register #16 %HD V1 V1/V12 Harmonic Distortions 1 V1 %HD01 H01 Harmonic distortion V1 %HD02 H02 Harmonic distortion … ...
Appendix C Parameters for Monitoring and Data Logging 168 Designation Description V2 H03 H03 Harmonic voltage … ... V2 H63 H63 Harmonic voltage HRM V3 V3/V31 Harmonic Voltages (odd harmonics) 1 V3 H01 H01 Harmonic voltage V3 H03 H03 Harmonic voltage … ... V3 H63 H63 Harmonic voltage HRM V4 V4 Harmonic Voltages (odd harmonics) V4 H01 H01 Harmonic voltage V4 H03 H03 Harmonic voltage … ...
Appendix C Parameters for Monitoring and Data Logging Designation Description I3 H01 I3 Current HRM TOT POW Fundamental Total Power Values kW H01 Total fundamental kW kvar H01 Total fundamental kvar PF H01 Total fundamental PF FLICKER Flicker 1 V1 Pst V1 short-term (10 min) flicker severity V2 Pst V2 short-term (10 min) flicker severity V3 Pst V3 short-term (10 min) flicker severity V1 Plt V1 long-term (2 hours) flicker severity V2 Plt V2 long-term (2 hours) flicker severity V3 Plt
Appendix C Parameters for Monitoring and Data Logging 170 Designation Description PF LEAD MIN MIN AUX I4 MIN In MIN FREQ MIN V UNB% MIN I UNB% MIN VDC MIN V4 MIN I4x MIN V4 THD MIN I4 THD MIN I4 TDD MIN MIN PRG PROG REG1 MIN PROG REG1 MIN … PROG REG16 MIN MAX PHASE V1 MAX V2 MAX V3 MAX I1 MAX I2 MAX I3 MAX kW L1 MAX kW L2 MAX kW L3 MAX kvar L1 MAX kvar L2 MAX kvar L3 MAX kVA L1 MAX kVA L2 MAX kVA L3 MAX PF L1 MAX PF L2 MAX PF L3 MAX V1 THD MAX V2 THD MAX V3 THD MAX I1 THD MAX I2 THD MAX I3 THD MAX I1 K
Appendix C Parameters for Monitoring and Data Logging Designation Description kW MAX kvar MAX kVA MAX PF MAX PF LAG MAX PF LEAD MAX MAX AUX I4 MAX In MAX FREQ MAX V UNB% MAX I UNB% MAX VDC MAX V4 MAX I4x MAX V4 THD MAX I4 THD MAX I4 TDD MAX MAX DMD V1 DMD MAX Total kW Total kvar Total kVA Total PF Total PF lag Total PF lead Maximum 1-Cycle Auxiliary Values I4 current In current Frequency Voltage unbalance Current unbalance DC voltage V4 voltage I4x current V4 THD I4x THD I4x TDD Maximum Demands V2 DMD
Appendix C Parameters for Monitoring and Data Logging 172 Designation Description ANALOG INPUTS AI1 AI2 … AI16 AI RAW AI1 RAW AI2 RAW … AI16 RAW AO RAW AO1 AO2 … AO16 TOU PRMS ACTIVE TARIFF ACTIVE PROFILE TOU REG1 TOU REG1 TRF1 TOU REG1 TRF2 … TOU REG1 TRF16 TOU REG2 TOU REG2 TRF1 TOU REG2 TRF2 … TOU REG2 TRF16 TOU REG3 TOU REG3 TRF1 TOU REG3 TRF2 … TOU REG3 TRF16 TOU REG4 TOU REG4 TRF1 TOU REG4 TRF2 … TOU REG4 TRF16 TOU REG5 TOU REG5 TRF1 TOU REG5 TRF2 … TOU REG5 TRF16 TOU REG6 TOU REG6 TRF1 TOU REG6
Appendix C Parameters for Monitoring and Data Logging Designation Description … TOU REG8 TRF16 TOU REG9 TOU REG9 TRF1 TOU REG9 TRF2 … TOU REG9 TRF16 TOU REG10 TOU REG10 TRF1 TOU REG10 TRF2 … TOU REG10 TRF16 TOU REG11 TOU REG11 TRF1 TOU REG11 TRF2 … TOU REG11 TRF16 TOU REG12 TOU REG12 TRF1 TOU REG12 TRF2 … TOU REG12 TRF16 TOU REG13 TOU REG13 TRF1 TOU REG13 TRF2 … TOU REG13 TRF16 TOU REG14 TOU REG14 TRF1 TOU REG14 TRF2 … TOU REG14 TRF16 TOU REG15 TOU REG15 TRF1 TOU REG15 TRF2 … TOU REG15 TRF16 TOU REG16 TO
Appendix C Parameters for Monitoring and Data Logging 174 Designation Description DMD3 TRF16 MAX TOU MAX DMD REG4 DMD4 TRF1 MAX DMD4 TRF2 MAX … DMD4 TRF16 MAX TOU MAX DMD REG5 DMD5 TRF1 MAX DMD5 TRF2 MAX … DMD5 TRF16 MAX TOU MAX DMD REG6 DMD6 TRF1 MAX DMD6 TRF2 MAX … DMD6 TRF16 MAX TOU MAX DMD REG7 DMD7 TRF1 MAX DMD7 TRF2 MAX … DMD7 TRF16 MAX TOU MAX DMD REG8 DMD8 TRF1 MAX DMD8 TRF2 MAX … DMD8 TRF16 MAX TOU MAX DMD REG9 DMD9 TRF1 MAX DMD9 TRF2 MAX … DMD9 TRF16 MAX TOU MAX DMD REG10 DMD10 TRF1 MAX DMD10
Appendix C Parameters for Monitoring and Data Logging Designation Description TOU MAX DMD REG15 DMD15 TRF1 MAX DMD15 TRF2 MAX … DMD15 TRF16 MAX TOU MAX DMD REG16 DMD16 TRF1 MAX DMD16 TRF2 MAX … DMD16 TRF16 MAX TOU Maximum Demand Register #15 Tariff #1 register Tariff #2 register … Tariff #16 register TOU Maximum Demand Register #16 Tariff #1 register Tariff #2 register … Tariff #16 register 1 In 4LN3, 3LN3 and 3BLN3 wiring modes, the voltages are line-to-neutral; for any other wiring mode, they will b
Appendix D EN50160 Statistics Log Files Appendix D EN50160 Statistics Log Files The following table lists the EN50160 evaluation parameters recorded by the device in the EN50160 statistics data log files. The second column shows data abbreviations used in the PAS data log reports. Data log file sections are highlighted in bold. EN50160 Compliance Statistics Log (Data Log #9) Field No.
Appendix D EN50160 Statistics Log Files Field No.
Appendix D EN50160 Statistics Log Files Field No.
Appendix D EN50160 Statistics Log Files Field No.
Appendix D EN50160 Statistics Log Files Field No.
Appendix E Data Scales Appendix E Data Scales The maximum values for volts, amps and power in the PM180 setup and in communications are limited by the voltage and current scale settings. See Advanced Device Setup in Chapter 7 on how to change the voltage and current scales in your device. The following table shows the device data scales.
Appendix F Device Diagnostic Codes Appendix F Device Diagnostic Codes Diagnostic Code Description 0 Critical error 1 2 3 4 5 7 8 9 Permanent fault (critical error) Memory/Data error Hardware watchdog reset DSP/Sampling fault CPU exception Software watchdog timeout Power down/Up Warm restart/Device reset 10 Configuration reset 11 12 RTC fault (critical error) Configuration fault (critical error) 14 15 16 17 20 21 22 24 Expanded memory fault CPU EEPROM fault AC board EEPROM fault I/O board EEPRO