
User Manual
Chapter 9 Viewing F I L E S
EM13x Series SMART MULTIFUNCTION METER 125
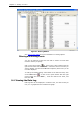
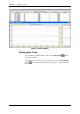
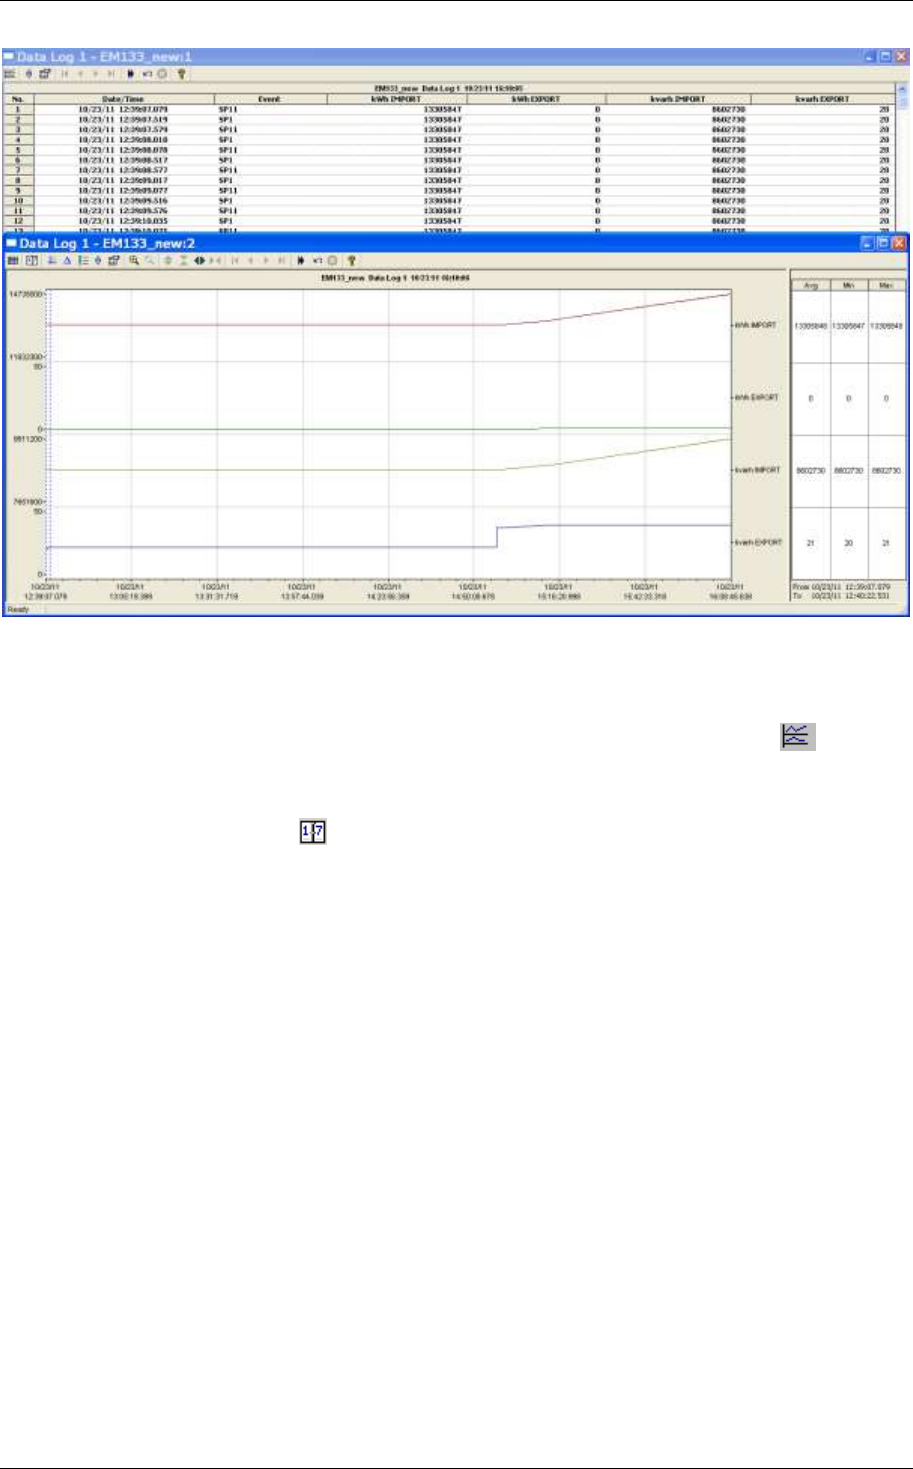
Figure 9-2: Data Log Window
Viewing Data Trend
To view data in a graphical form, click on the Data Trend
button
on the local toolbar.
To change the time range for your graph, click on the Time Range
button on the local toolbar, and then select the desired date and
time range.