
User`s guide

D.4 Improving data table accessibility
Large tables of data can be difficult to interpret if a person is using a non-visual means of accessing
the web, such as a screen reader. People using screen magnifiers or the Zoom feature may also find
data tables hard to navigate because they cannot see the table headings at all times. It can easily
become difficult to associate the value that a screen reader is reading with the corresponding column
and row headings. Users need to be able to understand the data value's position in the table and its
relationship to other values.
To improve data table navigation, you can use text objects to provide contextual information with each
value. Using conditional formatting or suppression, you can create a report that displays these objects
only if the user chooses to view them. Other design guidelines can help make large tables of data easier
to understand, such as providing summary paragraphs and expanded column headings.
Note:
This section uses terminology consistent with the W3C accessibility guidelines. In these guidelines, the
term data table refers to values arranged in columns and rows. In Crystal Reports, data tables take the
form of group or page headings combined with database fields in the Details section. Do not confuse
data tables with database tables, which are data sources used by Crystal Reports.
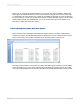
D.4.1 Text objects and data table values
You can make a large table easier to understand and navigate by adding text objects that provide
information about each value in the table.
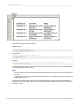
Include whatever information is necessary to establish the meaning and context of the value displayed.
When appropriate, include information that describes column headings or neighboring fields. For
example, if a report displays employee names and salaries, you can add a text object before the Salary
database field that reads "{Last Name}'s salary is ". The user can determine the context and meaning
of the value by reading the accompanying text object.
Ensure that your text objects use punctuation that will make the content easier to understand when
read aloud by a screen reader. Without accessibility-orientated punctuation, data tables may be read
as one long sentence, making navigation and interpretation very difficult. For example, you can add
periods after values so a screen reader will pause between columns and rows. For details, see Using
punctuation.
As with all objects in reports, the order in which you place text objects on the report can affect
accessibility. Screen readers read the objects in the order they were originally added. (For details, see
Placing objects in order.) The correct placement order is critical when you add a text object that identifies
the contents of a particular column in a data table. If you add the text objects at the end of the design
process, they may be read after the columns that they refer to. When you add text objects that describe
values in a report, ensure that you place them on the report in the order that you want them to be read.
2012-03-14693
Creating Accessible Reports