
User`s guide


1.
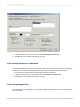
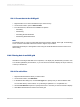
On the Customize Style tab of the OLAP Expert, click Format Grid Lines.
The Format Grid Lines dialog box appears.
2.
From the list, choose the description of the area where you would like the lines to appear, or click
the appropriate area in the Format Grid Line diagram.
3.
Select the Draw check box to have your lines appear in the report.
4.
Select the color, style, and width.
5.
Click OK.
6.
Click OK if you have finished customizing your grid.
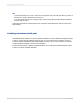
17.4.4 Labeling dimensions
In the Labels tab, you are able to define which dimensions will be labeled and how they will be displayed
in the grid. The dimensions available to you are the ones that have been designated as a page or slice.
1.
Using the arrow buttons, move the dimensions to the Unlabeled and Labeled areas as required.
2.
Make changes to the appearance of the label by using the options available in the Label Position
and Label Spacing areas.
3.
Click OK if you have finished customizing your grid.
17.5 Changing the view of OLAP data
When analyzing OLAP data in your report, there are several basic ways to change how the data is
displayed in the grid.
Note:
The methods described here let you manipulate your OLAP grid directly from the Preview tab of Crystal
Reports. You can also carry out the same and additional, more advanced, functionality on the Cube
View tab.
Search the online help for "Using the OLAP Worksheet" to learn more about the functionality available
on the Cube View tab.
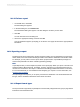
17.5.1 To show or hide dimension members
1.
Right-click the dimension whose members you want to show or hide.
2.
On the shortcut menu, click Expand Member or Collapse Member.
2012-03-14372
Creating and Updating OLAP Reports