
User`s guide

Note:
The color of the style you select may not appear correctly if your screen resolution is set to 256
colors. Increase the resolution to correct this.
2.
Click Next.
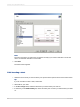
The Chart screen appears.
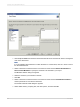
17.2.6 Inserting a chart
1.
Select the kind of chart you want to add to your report from the options shown on the Chart screen.
Tip:
If you do not want to insert a chart, click Finish.
2.
Add a title for your chart.
3.
In the On change of list, select the dimension you want to base your chart on.
4.
If necessary, in the Subdivided by list, click a secondary row or column you want to base your chart
on.
2012-03-14367
Creating and Updating OLAP Reports