
User`s guide
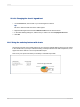


To map on a group, you can use the Group layout, in which you show a summary (such as Last Year's
Sales) on change of a geographic field (such as Region). In order to create a map using the Group
layout, you must have at least one group and at least one summary field for that group.
13.2.1.1 To map on a group
1.
On the Insert menu, click Map.
Tip:
Another way to do this is to click the Insert Map button on the Insert Tools toolbar.
The Map Expert dialog box appears.
2.
On the Data tab, in the Layout area, click Group, if it is not already selected.
3.
In the Placement area, in the Place map list, specify how often your map appears on the report,
then click Header or Footer to specify where to place your map.
4.
In the Data area, in the On change of list, click the group field you want to base your map on, then
in the Show list, click the summary field you want to display on your map.
5.
Click the Type tab.
6.
Click the map type that best illustrates your data (Ranged, Dot Density, or Graduated). See Map
types.
7.
In the Options area, apply formatting options to your map.
8.
Click the Text tab.
9.
In the Map title field, enter a title for your map.
10.
In the Legend area, you can click one of the following options:
• Full legend to show a detailed legend on your map.
• Compact legend to show a condensed legend on your map.
• No legend to exclude the legend from your map.
11.
If you click Full legend, click Made by map to have Crystal Reports create a legend title based on
your map, or click Specify to enter your own legend title and subtitle.
12.
Click OK.
Your map is placed in the Header or Footer section of the report, depending on your selection in
Step 3.
13.2.2 Mapping on Cross-Tab summaries (Cross-Tab layout)
2012-03-14290
Mapping