
User`s guide


Note:
In order to create a map using the Group layout, you must have at least one group and at least one
summary field for that group.
Cross-Tab
Use the Cross-Tab layout when mapping on a Cross-Tab object. A Cross-Tab map does not require
groups or summary fields.
OLAP
Use the OLAP layout when mapping on an OLAP grid. An OLAP map does not require groups or
summary fields.
Note:
If there is no map associated with the data you specify, then an empty block will appear unless the
section that the map is placed in has been formatted to suppress if blank.
13.1.3 Map types
The Map Expert also provides five basic map types, each suitable for a different strategy of data analysis.
When deciding which map type best fits your report, you should consider the type of data you want to
analyze. For example, if you want the map to display one data item for each geographic division (city,
state, country, and so on), then you might use a Ranged, Dot Density, or Graduated map. On the other
hand, if you want the map to display more than one value for each new geographic division, then you
could use a Pie Chart map or a Bar Chart map. The following is an overview of the main map types
and their most common uses.
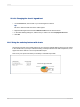
Ranged
A Ranged map breaks the data into ranges, assigns a specific color to each range, then color codes
each geographic area on the map to display the range. For example, you could create a map that
displays Last Year's Sales by Region. If you have sales ranging from zero to 100,000, you might give
the map five ranges, with equal intervals of 20,000 each. You could use shades of red (going from dark
to light red) to color code each region according to those sales figures. Then you could use this map
to see where sales are the highest.
With equal intervals, you might end up with all your regions ranging between zero and 20,000, except
perhaps one region (for example, California) that might have exceptionally high sales (such as 98,000).
This map would be a very distorted representation of the data. A more useful map would have ranges
like 0-5000, 5000-10000, 10000-15000, 15000-20000, and over 20000. It is important to carefully define
your ranges.
Note:
The end value for each division is repeated as the start value for the next division; the actual value is
included in the group it starts. That is, the ranges in the previous example are actually: 0-4999,
5000-9999, and so on.
There are four different distribution methods for ranged maps.
2012-03-14286
Mapping