
User`s guide


12.3.6 Formatting charts
12.3.6.1 Changing the border of a chart
1.
On the Design or Preview tab, right-click the chart to bring up the shortcut menu.
2.
On the shortcut menu, click Format Background.
3.
On the Format Editor dialog box, click the Border tab to see its options.
4.
Change the line style, color, or thickness.
5.
Click OK to save your changes.
Crystal Reports returns you to the report and implements your changes.
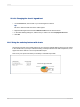
12.3.6.2 Conditionally formatting a chart
1.
On the Design or Preview tab, right-click the chart to bring up the shortcut menu.
2.
On the shortcut menu, click Chart Expert and select the Color Highlight tab.
For information about the expert, search the online help for Chart Color Format Expert.
Note:
• The option to apply conditional formatting is not available for every chart type.
• An area chart must have two "On change of" values for conditional formatting to appear.
• If your chart type is line, the chart must have data markers before you can see conditional
formatting.
• After you apply conditional formatting, you must select "Color by Group" on the Look tab of the
Chart Options dialog box before you will be able to see your formatting. To set this option,
right-click your chart, point to Chart Options on the shortcut menu, and select General from the
submenu. This note applies to line, 3-D Riser, and 3-D Surface charts with one "On change of"
field, as well as to bar, numeric axis, 3-D Surface, radar, stock, and charts with two summaries.
3.
Click OK.
2012-03-14282
Charting